


American Financial Group (AFG) has put fresh attention on its income profile after declaring a regular quarterly dividend of $0.97 per share, a 10.2% uplift versus the annual rate set since late 2025.
Recent trading has been choppy. American Financial Group’s share price has inched up over 2026 with a year to date share price return of 2.44%. The 30 day share price return is down 3.05%, while the 3 year total shareholder return of 46.95% points to stronger longer run compounding.
Scan American Financial Group alongside a hand picked 7 dividend fortresses to see how this dividend move compares with other income focused opportunities.
American Financial Group has lifted its regular payout while the share price has barely moved this year. Is most of the easy return already in the rear view mirror, or does valuation still point to further upside ahead?
Most Popular Narrative: 11.4% Undervalued
On the latest numbers, the most followed narrative tags American Financial Group as undervalued, with a fair value of $155.83 against a last close of $138.08. That gap rests on a view that underwriting discipline, investment yields and capital returns can do more work than the recent share price suggests.
The main factor is that American Financial Group continues to produce attractive combined ratios in specialty lines, including social inflation exposed casualty and commercial auto, while sustaining productive use of excess capital and expanding AI driven efficiency gains.
The current valuation implies that investors are not fully pricing in this mix of underwriting profitability, sizeable capital returns and higher yielding reinvestment, so the share price may leave room for a more positive outcome than the market is assuming.
See why 12 investors see American Financial Group as 11% undervalued.
Result: Fair Value of $155.83 (UNDERVALUED)
Still, the American Financial Group story can break if social inflation keeps pushing losses higher, or if weaker alternative investment returns drag on earnings momentum.
Find out about the key risks to this American Financial Group narrative.
Another View: Market Ratios Tell A Different Story
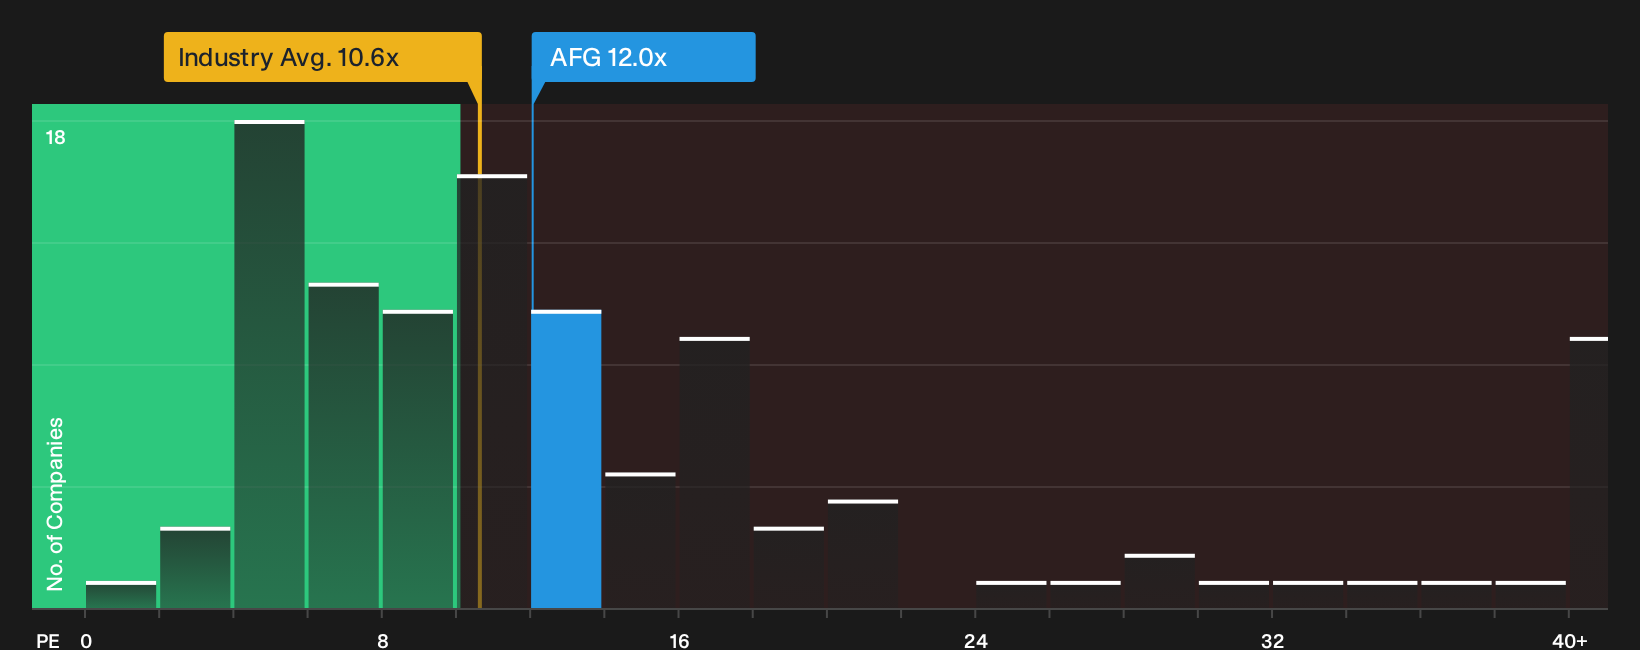
There is a twist when you look at American Financial Group through simple market ratios instead of fair value models. The stock trades on a P/E of about 12x, which is lower than a peer average of 14.1x, yet above a fair ratio estimate of 9.8x and also higher than the US Insurance industry on 10.6x. That mix points to a share that screens cheaper than some competitors but still carries valuation risk if earnings stumble or sentiment cools.
For a closer look at how this price compares with what the numbers suggest investors might eventually pay attention to, review the See what the numbers say about this price — find out in our valuation breakdown. and see where American Financial Group now sits against its sector peers and fair ratio target.
Next Steps
Mixed signals around American Financial Group can pull opinions in opposite directions. Consider reviewing the data for yourself and weighing both sides using the 1 key reward and 2 important warning signs.
Looking for more investment ideas beyond American Financial Group?
If you want a clearer picture of where to put your next dollar to work, use the Simply Wall St screener to compare opportunities before they move without you.
- Target resilient income by checking companies that match the 7 dividend fortresses and see which payouts look better supported by current fundamentals.
- Hunt for potential mispricing through the 19 high quality undiscovered gems and spot solid businesses that may not be getting much attention yet.
- Dial down portfolio risk by scanning the 31 resilient stocks with low risk scores so you can focus on stocks with steadier profiles and fewer red flags.
This article by Simply Wall St is general in nature. We provide commentary based on historical data and analyst forecasts only using an unbiased methodology and our articles are not intended to be financial advice. It does not constitute a recommendation to buy or sell any stock, and does not take account of your objectives, or your financial situation. We aim to bring you long-term focused analysis driven by fundamental data. Note that our analysis may not factor in the latest price-sensitive company announcements or qualitative material. Simply Wall St has no position in any stocks mentioned.
Have feedback on this article? Concerned about the content? Get in touch with us directly. Alternatively, email editorial-team@simplywallst.com