


The Zhitong Finance App learned that two months ago, J.P. Morgan still believed that the deleveraging of US stocks had cleared up the previous excess amount. Now it has taken back half of that sentence. The bank's global market strategy team said in the “Capital Flow and Liquidity” weekly report released on September 30 that the “excess” of some leverage and stock position indicators has returned to the market and may become a headwind for the stock market in the fourth quarter — the main title of the report is “Stock Market Vulnerability.”
Strategist Nikolaos Panigirtzoglou (Nikolaos Panigirtzoglou) wrote: “High levels of stock positions and leverage have reappeared. Although not as high as June and July of this year, they still posed a challenge to the stock market in the fourth quarter.”
Seven indicators: where did leverage come back
The report split the “excess” return into seven chains of evidence.
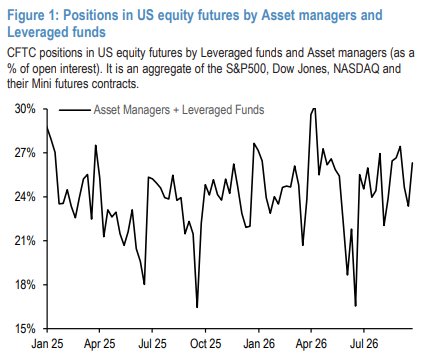
First, the leverage established through US stock index futures has rebounded and is close to a high level during the year. The bank's position index is based on US Commodity Futures Trading Commission (CFTC) data, which counts asset management and leveraged fund positions on S&P 500, Dow Jones, NASDAQ and their mini contracts, calculated as a proportion of open contracts.
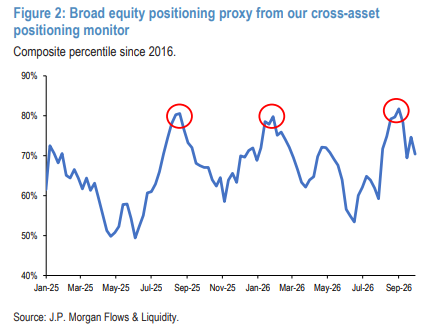
Second, the broader comprehensive index of stock positions peaked in September, with previous highs in January 2026 and August 2025.
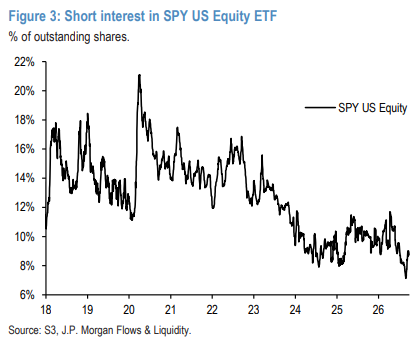
Third, the world's largest stock ETF, SPY, which tracks the S&P 500, began to bottom out after hitting a record low in early September.
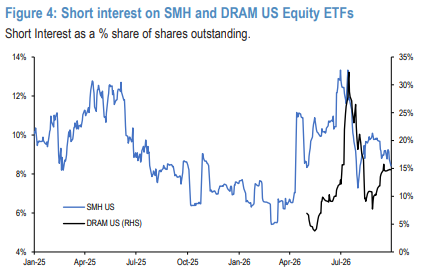
Fourth, semiconductor ETFs (SMH and memory stock ETF DRAM) have normalized their previously high bearish interest, indicating that “the previous bears' back-up has basically come to an end.”
Fifth, momentum signals show that trend-following traders (CTAs) have begun to rebuild bulls on the NASDAQ, Korea KOSPI, Taiwan, and Nikkei indices, “but they are still far below the previous extreme values”; the report also noted that the popular “sell China Internet Company (HSCEI) and buy Korean and Taiwanese stocks” relative transactions from April to June reappeared from August to September.
Sixth, the ratio of the asset size of leveraged stock ETFs to the market value of the underlying stock has rebounded in recent weeks. Currently, it is about 70% of the April low and June high; the recovery of leveraged products related to memory stocks is not obvious, and they are still in about 50% of this range. The report suggests that if the overall size of leveraged ETFs continues to expand, their problems as a trigger for deleveraging and a source of excessive volatility may once again become a risk point for the stock market.
Seventh, it is also the one that the report believes is most wary of: margin account leverage.
The hardest one: $1.45 trillion and 4.5% of GDP
The net debit balance (Net Debit Balance) of JPMorgan's NYSE margin account is a proxy indicator of leverage for individual investors in the US. The report notes that the indicator was at a “very high level” in August, while deleveraging in June and July barely changed it, so “it remains a major vulnerability for the stock market.” The report explains the mechanism: hedge funds can be leveraged more conveniently and at a lower cost through options and futures, while individual investors are more subject to the Federal Reserve's Regulation T (Regulation T) — which stipulates that they can borrow up to 50% of the purchase price when buying securities on margin; the net debit balance is equal to the margin debit balance, minus the credit balance of the cash account and margin account.
Market-side data confirms this judgment. According to monthly statistics from the US Financial Industry Regulatory Authority (FINRA), US margin debt increased by about 36.6 billion US dollars (2.6% increase) to 1.4538 trillion US dollars in August, the second highest in history, after the peak of 1.502 trillion US dollars in June; a cumulative increase of about 228 billion US dollars (19% increase) since this year, the year-on-year increase was about 37%. Extending the timeline, investor loans have increased by $847 billion since the end of 2022 (140% increase), while the S&P 500 index rose 98% during the same period — leverage is expanding significantly faster than market capitalization itself.
Compared to the total economy, margin debt is already equivalent to about 4.5% of the US GDP, up from about 3.6% of the peak cycle in 2021 and 2.8% during the Internet bubble in 2000. J.P. Morgan Chairman and CEO Jamie Dimon (Jamie Dimon) also publicly stated earlier that “market leverage is quite high.”
A distinction needs to be made here: J.P. Morgan Chase uses NYSE net debit balances, and FINRA publishes customer margin account financing balances. The two have different statistical ranges and cannot be directly equated or added together.
Why is J.P. Morgan still optimistic about technology: the three fundamental pillars
Despite pointing to headwinds in positions and leverage, this weekly report did not turn bearish. The report emphasizes that the bank's stock research team still believes that the technology/AI sector has fundamental support, and “even if there is another stock VaR shock similar to June and July, it will not derail the tech bull market.” The support comes from three bars:
First, memory prices are still on the rise, providing fundamental support for memory manufacturers — the latter has always been a high-beta variety in the technology/AI sector. This direction is consistent with this newspaper's previous storage tracking: Goldman Sachs's October 1 report predicts that DRAM and NAND contract prices will continue to rise in the fourth quarter, and sees enterprise-grade SSDs as the only accelerated category.
Second, capital expenditure expectations for hyperscale cloud vendors have been raised significantly. According to the aggregated bottom-up analysts' consensus, the total capital expenditure of the five major vendors (Google, Amazon, Meta, Microsoft, and Oracle) is estimated to be $804.9 billion in 2026 and $1.0918 trillion in 2027, up from $758 billion and $925 billion on July 1. This level of consensus is largely in line with market expectations quoted in Goldman Sachs's September 24 report (around $800 billion in 2026 and $1.1 trillion in 2027); Goldman Sachs's own predictions are more aggressive, at $1.2 trillion in 2027 and $1.4 trillion in 2028, and estimates that if these investments are to balance the average annual capital expenditure from 2026 to 2027, it would be necessary to generate around $300 billion in annual AI revenue over the next few years.
Third, the price of AI computing power remains strong. J.P. Morgan Chase uses Compute Desk's Hopper US Index as a proxy indicator — the index summarizes the on-demand and reserved prices of US neocloud vendors renting Nvidia H100/H200, in USD/GPU/hour — indicating that after continued pressure at the end of 2025, computing power prices have shown signs of improvement in recent months; the report suggests that the higher the price of computing power, the stronger the ability of hyperscale manufacturers to maintain or increase profit margins, and the trend of the index also made some investors “overestimate the equipment” The hypothesis of “obsolescence and depreciation” has been questioned. Independent data on the industry side is similar: computing power pricing agency Ornn's H200 settlement price index reported $5.96 per GPU/hour on October 1, up 32.2% in 30 days, with a three-month range of $4.01 to $5.96.
The other side: the breadth worsens, “it's not AI that fails”
In addition to warnings about positions and leverage, US stocks themselves left a few unhealthy marks in September.
Throughout September, the S&P 500 index fell slightly by 0.4%, from a record high of 1.9% in August; the Nasdaq Composite Index rose 1.8% and hit a record high on September 22; however, the Dow Jones Industrial Average fell 4.3%, and the Russell 2000 Index, which is dominated by small-cap stocks, fell 5.4%. Interactive Brokers chief strategist Steve Sosnick (Steve Sosnick) summed this up as a “failure if it wasn't AI” market.
A more specific broadness signal appeared on September 21: S&P 500 rose 1.49% to 7,764.70 points on the same day, only about 0.4% short of the record closing, but the number of constituent stocks (30) that hit a 52-week low on the same day surpassed the number of 52-week highs (7), the first time since December 1999 that this combination of “the index is high and the net new high is negative”; according to Dow Jones market data, 59.2% of the S&P 500 constituent stocks have fallen at least 20 from their historical highs %
The same set of facts also elicited two voices within J.P. Morgan Chase. Just the day before this week's alarm showed “excessive positions and leverage,” the bank's market intelligence team led by Andrew Tyler (Andrew Tyler) turned tactical bullish in the September 29 client report, citing stronger macro data than expected, stabilizing the bond market, falling oil prices, and expecting the technology and semiconductor sector to continue to outperform.
The other side of the divide comes from the scale of AI investments itself. Morgan Stanley strategist Michael Wilson (Michael Wilson) said that a further rise in oil prices and refined oil prices is the main near-term risk preventing the market from reaching its year-end target; Arend Kapteyn (Arend Kapteyn), chief economist at UBS, estimates that AI-related investments and wealth effects from rising AI stocks already account for more than 80% of the US economic growth, rather than the AI sector's capital expenditure “almost zero” — this is both a support for growth and a source of concentration risk.
Two-way judgment
As far as the fourth quarter is concerned, the report actually gave a two-way judgment: on the one hand, “excess” positions and leverage have returned from multiple sources, and margin account leverage is the most stubborn and closest to retail investors; on the other hand, J.P. Morgan believes that the three fundamental pillars of technology/AI — memory prices, trillion-dollar capital expenses, and strong computing power prices — have not wavered, so the more likely scenario is an increase in volatility rather than an end to the bull market.
The report didn't give a point forecast, but it narrowed the observation window: what we really need to keep an eye on is that any of these three pillars begins to loosen.