


The feud between Compass (COMP) and Zillow over which listings stay public and which stay behind walled gardens has put data access at the center of the real estate conversation.
Compass shares trade at US$9.22, with short term momentum under pressure as the 30 day share price return declined 17.09% and the 90 day move fell 29.02%. This comes even though total shareholder return over the past 3 years is very large and the 1 year total shareholder return is 17.75%.
Capitalize on the spotlight on Compass by scanning a hand picked 19 high quality undiscovered gems that could be quietly building similar leverage in niche data and access advantages.Short term momentum has cracked, yet Compass still trades at a clear gap to analyst targets and implied intrinsic value. Does that setback now tilt the risk reward toward fresh buyers, or toward patience as the valuation work begins?
Most Popular Narrative: 40% Undervalued
Compass last closed at $9.22, while the most followed narrative pegs fair value at $15.42 using a 9.51% discount rate. This frames the current slide against a much higher long term anchor.
Rapid adoption and continuous improvement of Compass's AI-powered, end-to-end technology platform is increasing agent productivity, driving higher transaction volumes, improving retention, and is expected to widen margins as AI-driven process efficiencies scale throughout the organization, positively impacting revenue, EBITDA, and net margins.
See why 16 investors see Compass as 40% undervalued.
Result: Fair Value of $15.42 (UNDERVALUED)
Still, Compass faces real pressure if commission focused revenue weakens or if litigation and regulatory changes reshape how agents and brokerages get paid.
Find out about the key risks to this Compass narrative.
Another Look At Compass Through Earnings Multiples
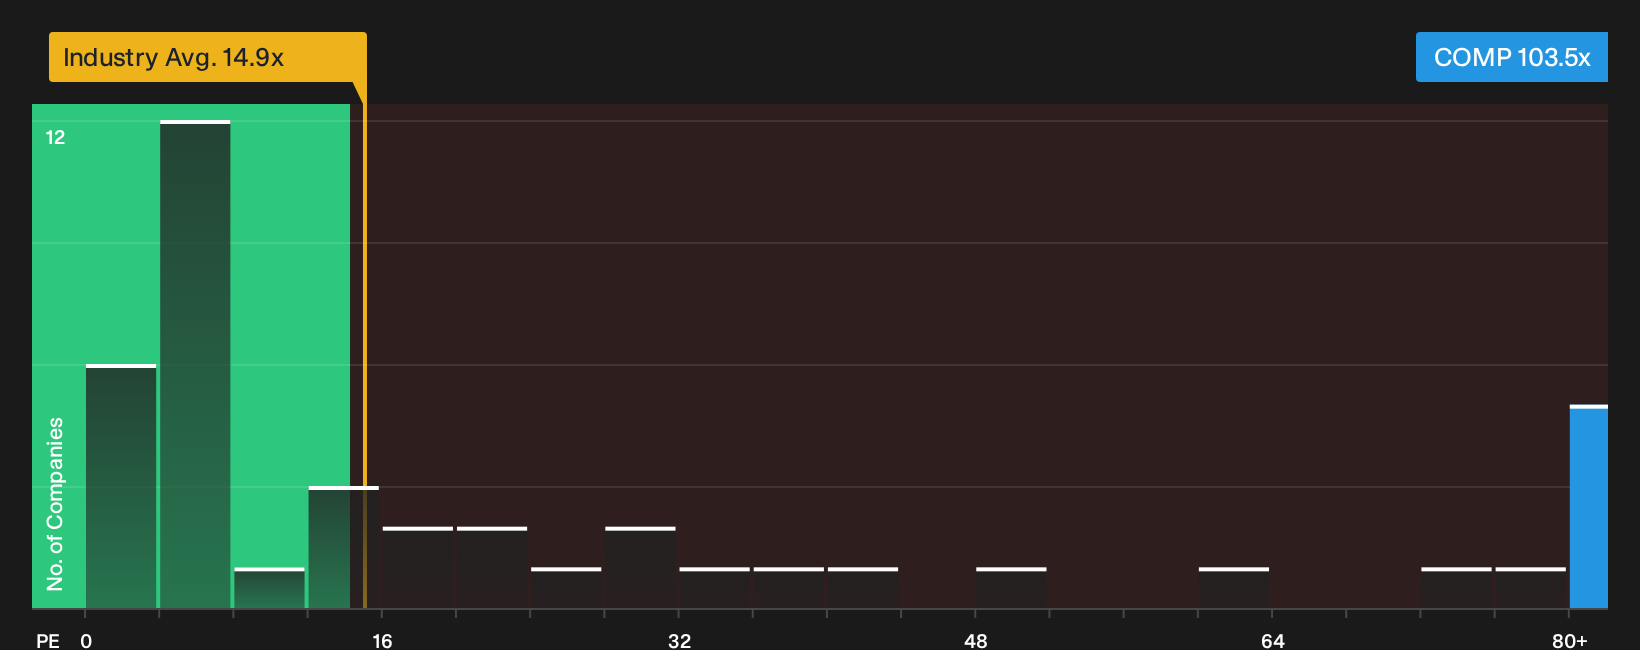
Compass might screen as undervalued against fair value estimates, yet its current P/E ratio of 103.5x paints a very different picture. The broader US Real Estate industry sits at 14.9x and peers average 73.6x, while the fair ratio for Compass is 44.8x.
That gap means investors today are paying a far higher price for each dollar of Compass earnings than both the industry and this fair ratio suggest. This raises the bar on execution and leaves less room for disappointment. Is that premium a sign of belief in the story or a source of valuation risk if expectations cool?
See what the numbers say about this price — find out in our valuation breakdown.
Next Steps
Mixed messages around Compass can make the picture feel fuzzy. Move quickly, work through the data yourself, and weigh both the upside narrative and the pushback captured in our 4 key rewards and 3 important warning signs
Looking for more Compass sized opportunities?
If Compass has your attention, do not stop here. Use the Simply Wall Street Screener to uncover other ideas that fit your risk, income, and quality preferences.
- Target steadier potential by reviewing a 31 resilient stocks with low risk scores that may hold up better when sentiment turns choppy.
- Hunt for quality at a discount by scanning a 31 high quality undervalued stocks that could offer stronger fundamentals than their current prices suggest.
- Build a cash flow focused portfolio by zeroing in on 7 dividend fortresses that may support more reliable income streams over time.
This article by Simply Wall St is general in nature. We provide commentary based on historical data and analyst forecasts only using an unbiased methodology and our articles are not intended to be financial advice. It does not constitute a recommendation to buy or sell any stock, and does not take account of your objectives, or your financial situation. We aim to bring you long-term focused analysis driven by fundamental data. Note that our analysis may not factor in the latest price-sensitive company announcements or qualitative material. Simply Wall St has no position in any stocks mentioned.
Have feedback on this article? Concerned about the content? Get in touch with us directly. Alternatively, email editorial-team@simplywallst.com