


Viking Therapeutics (VKTX) has just cleared an important hurdle. Fresh positive top-line data from its VK2735 obesity maintenance study, combined with follow-on equity and convertible note offerings, has reshaped the backdrop for the stock.
Recent trading tells a more mixed story. Despite a surge around the VK2735 readout and the combined US$500m plus equity and convertible offerings, Viking Therapeutics now trades at US$29.94 per share. The 7-day share price return is down 15.8% and the 90-day share price return is down 22.7%, while the 3-year total shareholder return of about 155% and the 5-year total shareholder return of roughly 4x still point to powerful longer term momentum.
Scan Viking Therapeutics alongside a hand-picked set of obesity and metabolic drug developers by checking the 35 healthcare AI stocks that could be next in line for market moving trial readouts.
Viking Therapeutics just raised more than US$500m after positive VK2735 data, yet the share price now sits well below both the US$35 offer and analyst targets. So where does a reasonable valuation anchor for this story actually sit?
Price to Book Of 8.6x For Viking Therapeutics: Is It Justified?
Valuation for Viking Therapeutics currently leans heavily on what investors are willing to pay versus its balance sheet. At a P/B ratio of 8.6x against a US Biotechs peer average of 2.1x, the market is attaching a much richer tag to each dollar of net assets at a $29.94 share price.
P/B compares the market value of the equity to the accounting value of shareholders' equity. For a clinical-stage biotech like Viking Therapeutics, that typically means investors are paying up for the drug pipeline, intellectual property, and optionality embedded in trial outcomes rather than current earnings or revenue, which is currently reported at $0.
The implication is straightforward. The market is pricing Viking Therapeutics at a sizeable premium to both its sector and its immediate peers. This suggests expectations for future value creation that extend well beyond the current balance sheet. With the stock described as expensive versus both the direct peer group average P/B of 4.1x and the broader US Biotechs mark of 2.1x, the bar for future execution and clinical success sits high.
That premium gap is large and persistent in the data. This means the P/B ratio of 8.6x is not just a slight stretch but a clear outlier compared to the rest of the US Biotechs industry on this metric.
See what the numbers say about this price — find out in our valuation breakdown.
Result: Price-to-book of 8.6x (OVERVALUED).
Still, the story around Viking Therapeutics hinges on clinical risk and the possibility that future VK2735 or VK2809 data will fail to meet investor expectations.
Find out about the key risks to this Viking Therapeutics narrative.
Another View On Viking Therapeutics: Our DCF Says Overvalued
A second lens tells a very different story. The SWS DCF model estimates Viking Therapeutics’ future cash flow value at $7.34 per share, well below the current $29.94 price. On this framework the stock screens as expensive, which raises a simple question: Which set of assumptions do you trust more?
Look into how the SWS DCF model arrives at its fair value.
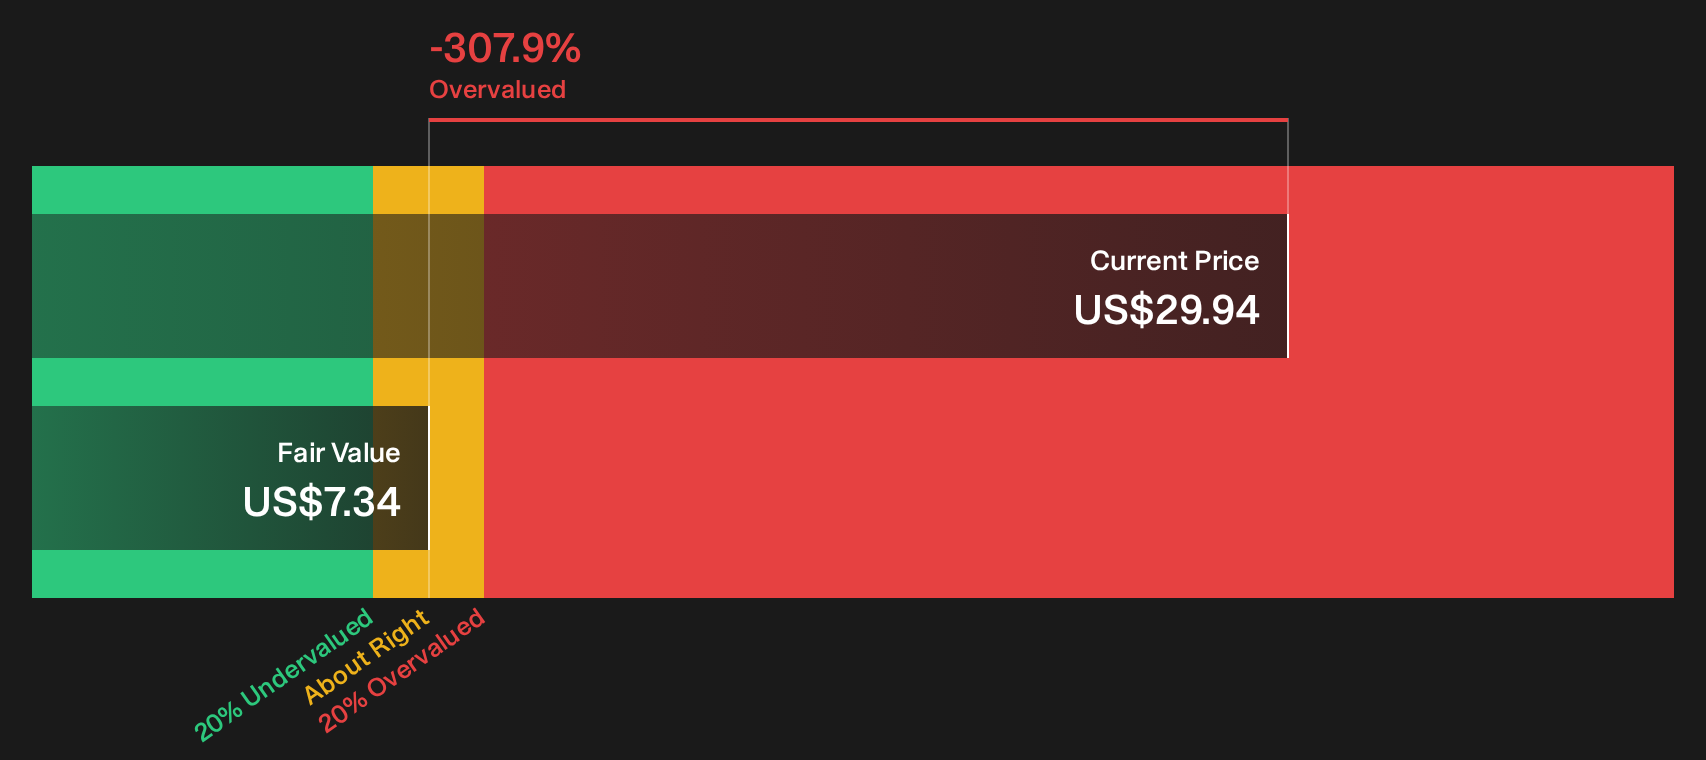
Simply Wall St performs a discounted cash flow (DCF) on every stock in the world every day (check out Viking Therapeutics for example). We show the entire calculation in full. You can track the result in your watchlist or portfolio and be alerted when this changes, or use our stock screener to discover 31 high quality undervalued stocks. If you save a screener we even alert you when new companies match - so you never miss a potential opportunity.
Next Steps
Mixed signals or clear message, Viking Therapeutics presents enough moving parts that it pays to inspect the underlying data yourself rather than lean on headlines. If you want a concise view of the main concerns investors are watching, you can start with these 4 important warning signs.
Looking For More Investment Ideas Beyond Viking Therapeutics?
If Viking Therapeutics has your attention, do not stop here. Broader context across other opportunities can sharpen your judgement and keep your capital working harder.
- Target resilient cash generators by scanning a 7 dividend fortresses that may appeal if you want income to complement higher risk biotech exposure.
- Hunt for potential bargains with a 31 high quality undervalued stocks that can help you spot mispriced businesses before the crowd pays attention.
- Prioritise strength and durability using a list of solid balance sheet and fundamentals (25 results) so you are not caught holding fragile companies when conditions get tougher.
This article by Simply Wall St is general in nature. We provide commentary based on historical data and analyst forecasts only using an unbiased methodology and our articles are not intended to be financial advice. It does not constitute a recommendation to buy or sell any stock, and does not take account of your objectives, or your financial situation. We aim to bring you long-term focused analysis driven by fundamental data. Note that our analysis may not factor in the latest price-sensitive company announcements or qualitative material. Simply Wall St has no position in any stocks mentioned.
Have feedback on this article? Concerned about the content? Get in touch with us directly. Alternatively, email editorial-team@simplywallst.com