


Recent Performance Snapshot for RBC Bearings
RBC Bearings (RBC) has drawn investor interest after a recent stretch of mixed returns. The shares are up over the past week and month, but have declined during the past 3 months.
Over the past day the stock gained about 1%, and it is ahead roughly 2% over the past week. Over the past month the move is closer to 6%.
The picture shifts over a longer window. The share price is down about 15% over the past 3 months, while the year to date return is a gain of roughly 12%.
Looking further back, the 1 year total return is about 38%. Over 3 years the total return is a little more than 11x the starting level, and over 5 years it is close to 14x.
For RBC Bearings, the recent bounce toward a US$515.56 share price comes after a 90 day share price return that declined 15.4%, while the 1 year total shareholder return of 37.9% shows longer term holders have still seen strong gains as sentiment has shifted over time around growth prospects and perceived risk.
Scan beyond RBC Bearings and see how it compares to other industrial specialists with resilient fundamentals using our hand picked list of solid balance sheet and fundamentals (25 results).
RBC Bearings has delivered big long term gains and runs a sizeable US$16.3b valuation, while the shares only just bounced after a 3 month slide. Is that current price actually attractive for fresh capital?
Most Popular Narrative: 18% Undervalued
On the most followed narrative, RBC Bearings screens as undervalued, with a fair value of about $630.67 against the recent $515.56 close. This puts the focus firmly on whether long dated contracts and cash generation can support that gap.
Consistent free cash flow generation, shown by US$342.6 million of free cash flow in fiscal 2026 with conversion above 100% and US$146.9 million in fiscal Q1 2027, together with ongoing debt reduction and the plan to fully repay the term loan by November 2026 while still funding acquisitions like PSC Couplings, can widen RBC Bearings’ capacity for future M&A and capital investment that supports revenue and net margins.
See why 4 investors see RBC Bearings as 18% undervalued.
Result: Fair Value of $630.67 (UNDERVALUED)
Still, the bullish story for RBC Bearings can unravel if specialty alloys remain tight or if new marine and aerospace capacity ends up underutilized and drags on margins.
Find out about the key risks to this RBC Bearings narrative.
Another View on RBC Bearings’ Valuation
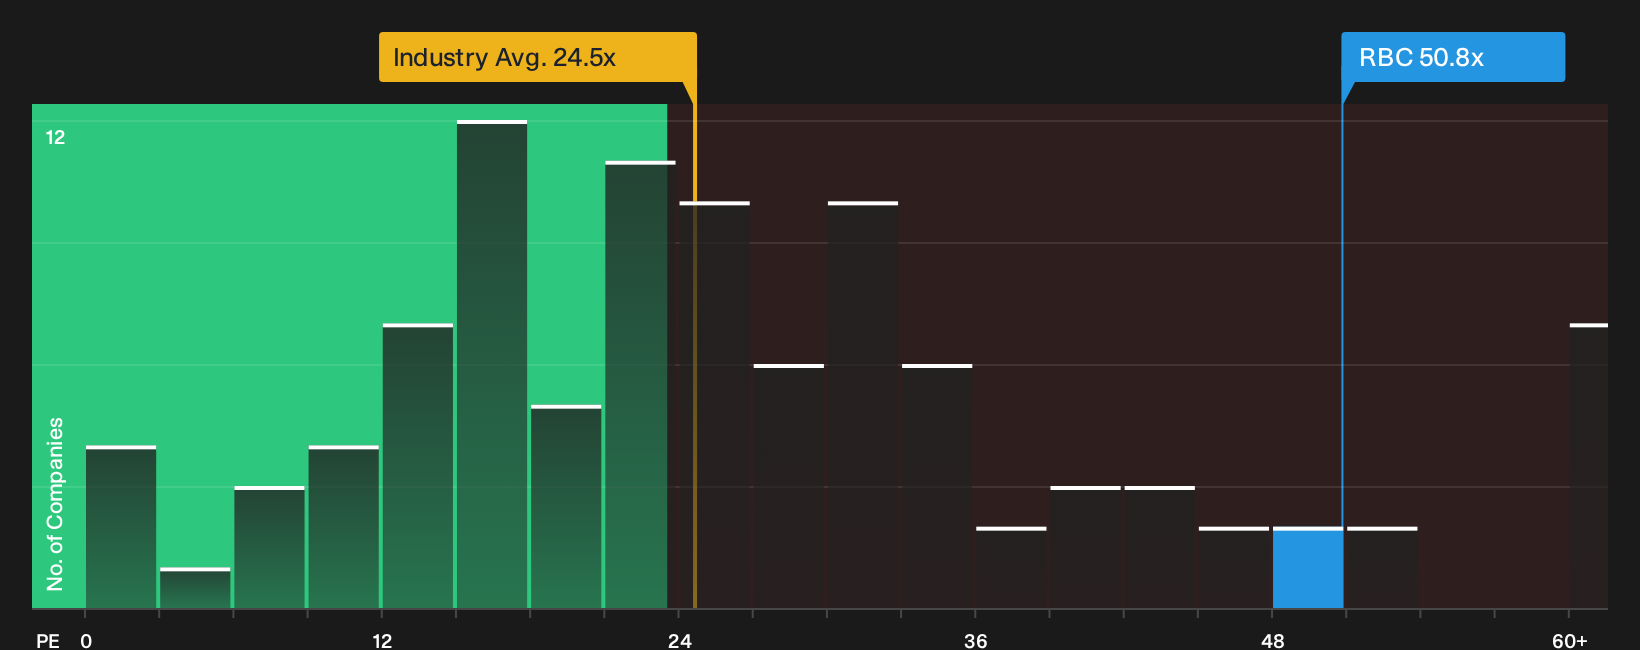
The earlier fair value of $630.67 leaned on analyst forecasts and long term contracts. A simple P/E check tells a very different story. RBC Bearings trades at about 50.8x earnings, compared with a fair ratio of 26.7x, the US Machinery sector on 24.5x, and peers near 30x. That kind of gap points to meaningful valuation risk if expectations cool even slightly.
For a closer look at how this pricing stacks up against earnings power over time, take a look at See what the numbers say about this price — find out in our valuation breakdown..
Next Steps
That mix of strong long term returns and a rich multiple can feel exciting and uncomfortable at the same time, so look through the drivers yourself and pressure test the optimism around RBC Bearings using 3 key rewards.
Looking for more investment ideas beyond RBC Bearings?
If RBC Bearings has sharpened your thinking on price, quality, and risk, do not stop here. Fresh ideas often come from broadening the watchlist.
Use the Simply Wall St Screener to scan new angles and avoid getting boxed into a single story around one ticker.
Spot potential value opportunities that pair quality with a discount by reviewing our 31 high quality undervalued stocks built around strong fundamentals and attractive pricing.
Lock in cash flow potential for your portfolio by checking out a hand picked set of income payers through the 7 dividend fortresses focused on robust yields.
Protect your downside first and allow for potential upside by running through the 31 resilient stocks with low risk scores that filters for resilient balance sheets and steadier risk profiles.
This article by Simply Wall St is general in nature. We provide commentary based on historical data and analyst forecasts only using an unbiased methodology and our articles are not intended to be financial advice. It does not constitute a recommendation to buy or sell any stock, and does not take account of your objectives, or your financial situation. We aim to bring you long-term focused analysis driven by fundamental data. Note that our analysis may not factor in the latest price-sensitive company announcements or qualitative material. Simply Wall St has no position in any stocks mentioned.
Have feedback on this article? Concerned about the content? Get in touch with us directly. Alternatively, email editorial-team@simplywallst.com