


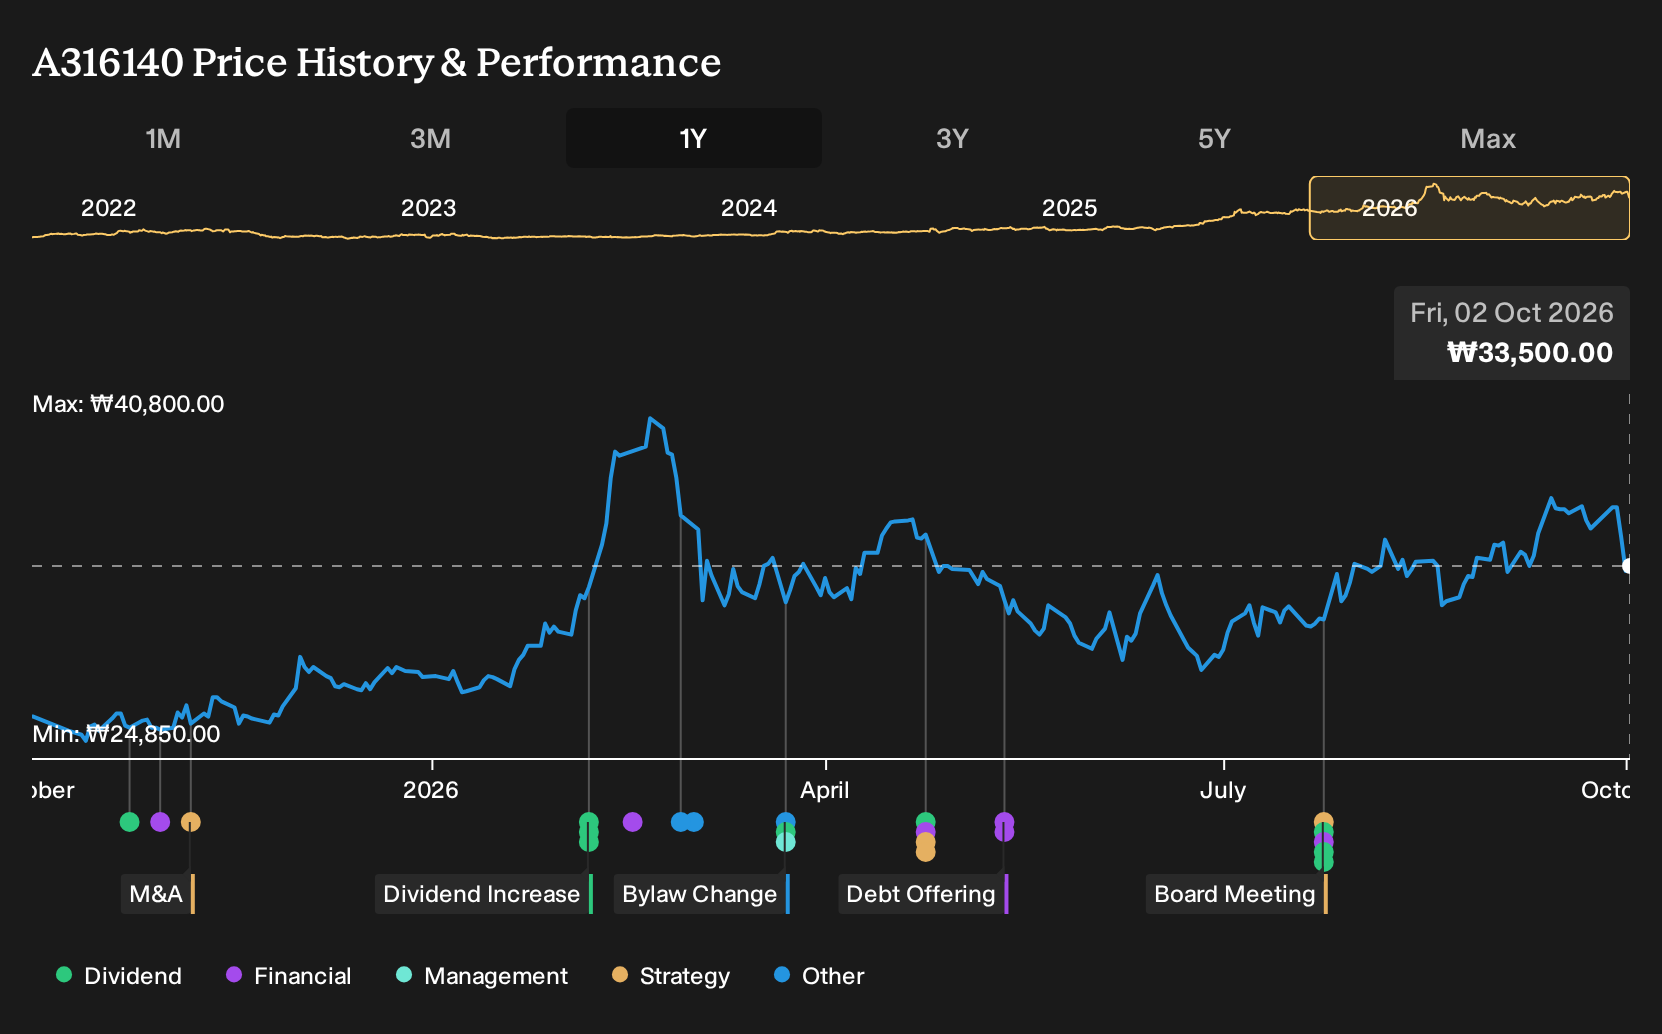
Holding Woori Financial Group over the past year would have returned 33.9%, including dividends. If you had bought on 2 October 2025, you were weighing bullish claims about digital expansion and newly folded-in insurers against worries about South Korea’s aging borrowers, compressed lending spreads, and rising fintech rivals. With fresh 2026 numbers showing revenue and profit both higher but a thinner net margin, the bigger question may be whether this is about growth itself or about the quality of that growth.
On Simply Wall St, a Narrative is an investor's thesis written down: the reasoning, plus the numbers it rests on. Run those numbers and you get an estimated Fair Value.
Woori Financial Group has already moved. See which of 194 high quality undervalued stocks still trade below our estimates.
The Argument You Would Have Been Weighing On Woori Financial Group
The shares cost ₩26,300 at the start of the period, and Woori Financial Group sat between two sharply different stories about where the business could reasonably go next.
On the bullish side, the Narrative pointed to a Fair Value of ₩36,500, leaning on expectations that fully integrated insurance affiliates and digital channels would lift fee income and raise assumed profit margins from 26.4% to 32.3% by 2028.
The bearish view set Fair Value at ₩18,000 and focused on South Korea's aging borrowers and domestic reliance, with assumed revenue growth of 2.5% a year and pressure from fintech rivals and credit risk in SME and real estate lending.
What The Results Changed For Woori Financial Group
The clearest new fact was the Q2 2026 report. Woori Financial Group posted revenue of ₩2,833,864m and net income of ₩965,545m, which supported the bullish case that called for higher sales and profit in absolute terms. The thinner net margin, down from 42.4% to 34.1%, backed the cautious argument about pressure on profitability. Overall, the evidence cut both ways.
The key lesson is about which assumption you test first. When a thesis leans on richer profitability, track net margin alongside revenue and earnings, and check whether each reporting period moves all three in the same direction.
What Woori Financial Group’s Price Now Assumes
Today Woori Financial Group trades at ₩33,500. This Narrative’s Fair Value sits above the current price and leans on a view that the fully integrated insurance arms and digital-first push could matter more over time than past lending headwinds suggest.
For a buyer today, the key question is whether the market fully credits cross-selling, fee growth, and digital economics from Woori’s broader financial group.
"While analysts broadly agree that Woori's ongoing capital optimization and diversified revenue expansion will stabilize margins and earnings, they are underestimating the step-change potential from the full integration of newly acquired insurance affiliates, which can deliver cross-sell synergies, expand fee income, and boost consolidated ROE faster than the market expects."
One Narrative disagrees with today's price. → See where this Narrative says Woori Financial Group should trade
Go Straight To The Source
By the time a rally makes headlines, you are reading about returns someone else has already earned. Why not go straight to the source and look for your own contrarian opportunity? These three companies trade below our estimated value.
- Company 1 - 26% below our estimate - uses automated operations, disciplined cash generation and hedging to improve consumer margins.
- Company 2 - 36% below our estimate - secures e-infrastructure construction contracts for mega data centers and advanced manufacturing facilities.
- Company 3 - 29% below our estimate - upgrades digital adviser and self-directed platforms to consolidate long-term pension investing.
Three companies from the same screener. Open all 207 companies with the balance sheet to back it up →
This article by Simply Wall St is general in nature. We provide commentary based on historical data and analyst forecasts only using an unbiased methodology and our articles are not intended to be financial advice. It does not constitute a recommendation to buy or sell any stock, and does not take account of your objectives, or your financial situation. We aim to bring you long-term focused analysis driven by fundamental data. Note that our analysis may not factor in the latest price-sensitive company announcements or qualitative material. Simply Wall St has no position in any stocks mentioned.
Have feedback on this article? Concerned about the content? Get in touch with us directly. Alternatively, email editorial-team@simplywallst.com