


Radware (RDWR) has put AI security in focus after unveiling its Agent Trust Management solution, which targets the growing flow of AI agent traffic and the risks around intent, access and sensitive data.
Recent trading has been constructive for Radware, with a 1-day share price return of 1.93%, a 7-day share price return of 4.21% and a 30-day share price return of 8.56%, taking the stock to $30.70. The year-to-date share price return of 29.10% and 3-year total shareholder return of 84.05% suggest momentum has been building around the story, as product updates like Agent Trust Management and its H1 2026 Global Threat Analysis Report keep attention on how the business is positioned in AI-focused security.
Scan beyond Radware and size up other security and AI plays using the hand picked screener of 90 AI infrastructure stocks.
Radware now trades almost level with the average analyst target, yet sits well above some implied fair value estimates. Is the recent AI security enthusiasm overpricing the shares, or still leaving room on the table?
Price-to-Earnings of 74.8x: Is it justified?
Radware trades on a P/E of 74.8x, which is a rich tag when you line it up against peers and the current share price of $30.70.
The P/E ratio compares what investors are willing to pay today for each dollar of reported earnings. For a cyber security and application delivery provider like Radware, a high P/E often signals the market is placing a premium on its profit trajectory, the quality of its AI security offerings, or both.
Earnings have grown 16% per year over the past 5 years and 21.9% over the past year, and net profit margins have edged from 4.9% to 5.4%. Those trends can help explain why investors might accept a steeper multiple, even with Return on Equity sitting at a modest 4.8% and revenue forecast growth of 7.9% per year lagging the broader US market estimate of 13.7%.
The gap to benchmarks is striking. Radware's 74.8x P/E is far above both the US Software industry average of 29.8x and the 28.4x peer average, which indicates the stock carries a substantial premium that the market is tying to its AI security positioning and profit track record rather than current profitability metrics.
See what the numbers say about this price — find out in our valuation breakdown.
Result: Price-to-Earnings of 74.8x (OVERVALUED).
Still, Radware’s valuation could unwind if AI security spending cools or if future earnings fail to line up with today’s hefty P/E expectations.
Find out about the key risks to this Radware narrative.
Another View on Radware’s Valuation
The rich P/E story is only one angle. Our DCF model points to a future cash flow value of $19.39 per share, compared with Radware’s current $30.70 price. This frames the stock as overvalued on this lens and raises the question of which yardstick deserves more weight.
Look into how the SWS DCF model arrives at its fair value.
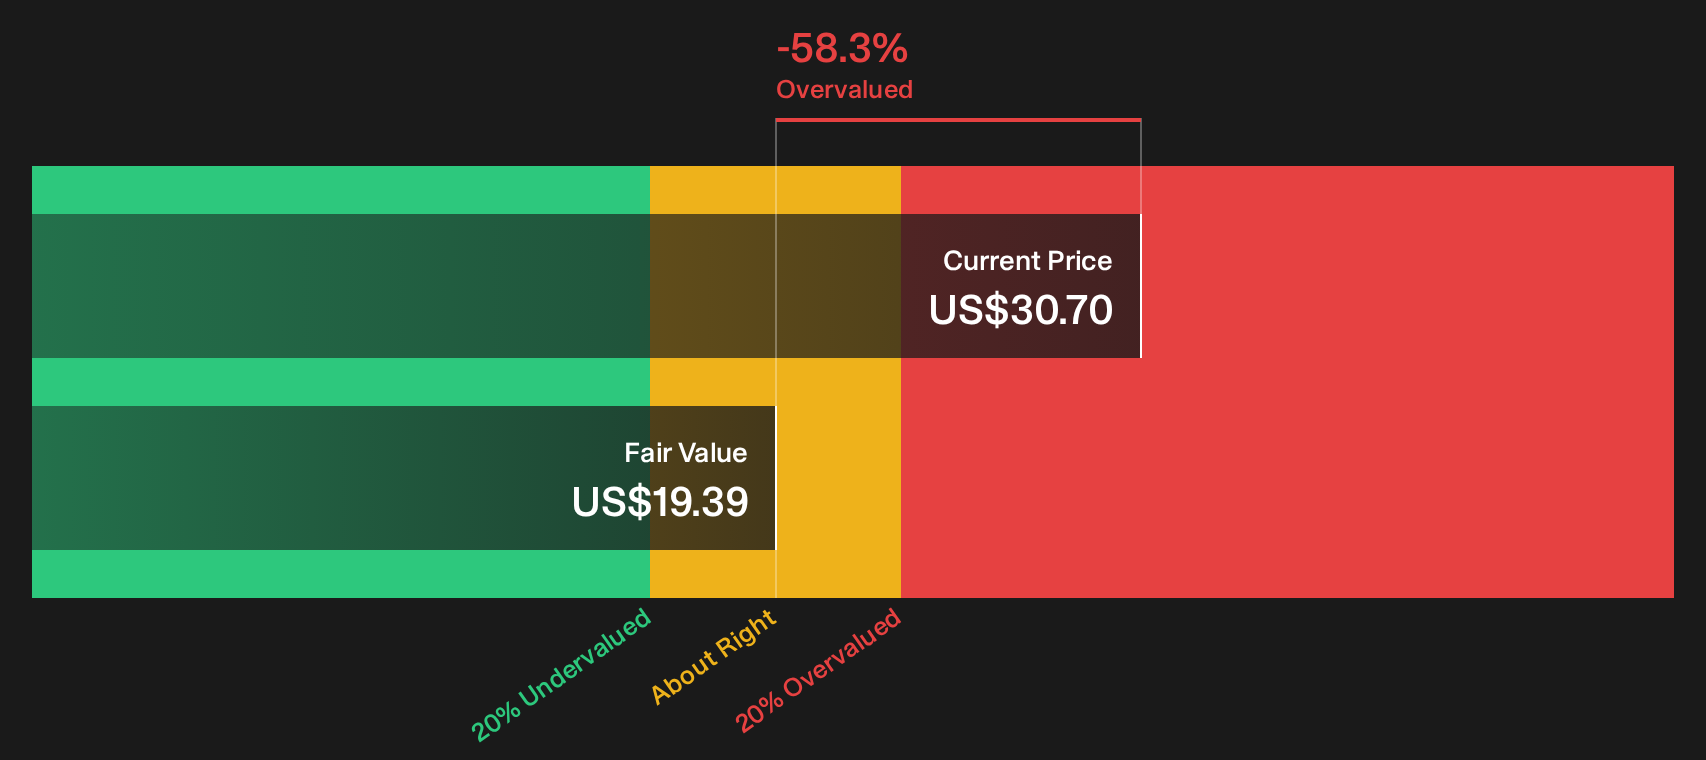
Simply Wall St performs a discounted cash flow (DCF) on every stock in the world every day (check out Radware for example). We show the entire calculation in full. You can track the result in your watchlist or portfolio and be alerted when this changes, or use our stock screener to discover 31 high quality undervalued stocks. If you save a screener we even alert you when new companies match - so you never miss a potential opportunity.
Next Steps
Curious whether Radware’s AI narrative really matches the risk and reward mix on the table right now? Dig into the underlying data, move fast, and weigh both sides with the help of 1 key reward and 2 important warning signs.
Looking for more investment ideas beyond Radware?
Do not stop your research with Radware. Broaden your watchlist and pressure test your thesis against other stocks that fit clear, disciplined criteria.
- Target potential mispricing by scanning a curated set of 31 high quality undervalued stocks that combine earnings strength with more modest expectations baked into the price.
- Prioritise resilience first and hunt through 31 resilient stocks with low risk scores that pair calmer price swings with balance sheets built to handle tougher conditions.
- Get ahead of the crowd and review 19 high quality undiscovered gems before attention and trading volumes catch up.
This article by Simply Wall St is general in nature. We provide commentary based on historical data and analyst forecasts only using an unbiased methodology and our articles are not intended to be financial advice. It does not constitute a recommendation to buy or sell any stock, and does not take account of your objectives, or your financial situation. We aim to bring you long-term focused analysis driven by fundamental data. Note that our analysis may not factor in the latest price-sensitive company announcements or qualitative material. Simply Wall St has no position in any stocks mentioned.
Have feedback on this article? Concerned about the content? Get in touch with us directly. Alternatively, email editorial-team@simplywallst.com