


Canadian Imperial Bank of Commerce (TSX:CM) just expanded its product shelf through three new mutual funds tied to ETF strategies, completing its ETF Portfolios lineup and giving growth focused investors another all equity option.
Those new ETF linked mutual funds arrive after a busy stretch for Canadian Imperial Bank of Commerce. The bank has been raising term funding through several fixed income offerings, while its 1 year total shareholder return of 43.22% and 3 year total shareholder return above 2.5x point to strong long run momentum. This comes despite a recent 30 day share price return that declined 2.75% from the current CA$158.27 level, suggesting sentiment has cooled slightly in the short term even as longer term holders have seen very large gains.
Scan how Canadian Imperial Bank of Commerce stacks up against other banks targeting growth oriented investors by reviewing our hand picked 6 high quality undervalued stocks in similar segments.
Canadian Imperial Bank of Commerce now trades about 8% below the average analyst target and around 32% under one intrinsic value estimate. Is that discount justified caution after a hot 1 year run, or mispricing that has gone too far?
Most Popular Narrative: 7% Undervalued
On the most followed view, Canadian Imperial Bank of Commerce screens modestly cheap, with a fair value of CA$170.18 against the recent CA$158.27 close. That gap is being framed around execution, capital strength and discipline on growth assumptions.
Strong capital position (13.4% CET1), ongoing share buyback programs, and rising ROE (5 consecutive quarters of year-over-year increases) provide flexibility to support both organic business growth and shareholder returns, contributing to earnings per share.
See why 115 investors see Canadian Imperial Bank of Commerce as 7% undervalued.
Result: Fair Value of CA$170.18 (UNDERVALUED)
Still, the bullish story around Canadian Imperial Bank of Commerce could be challenged if Canadian mortgage delinquencies rise further or if regulatory costs erode profitability expectations.
Find out about the key risks to this Canadian Imperial Bank of Commerce narrative.
Another View On Canadian Imperial Bank of Commerce Valuation
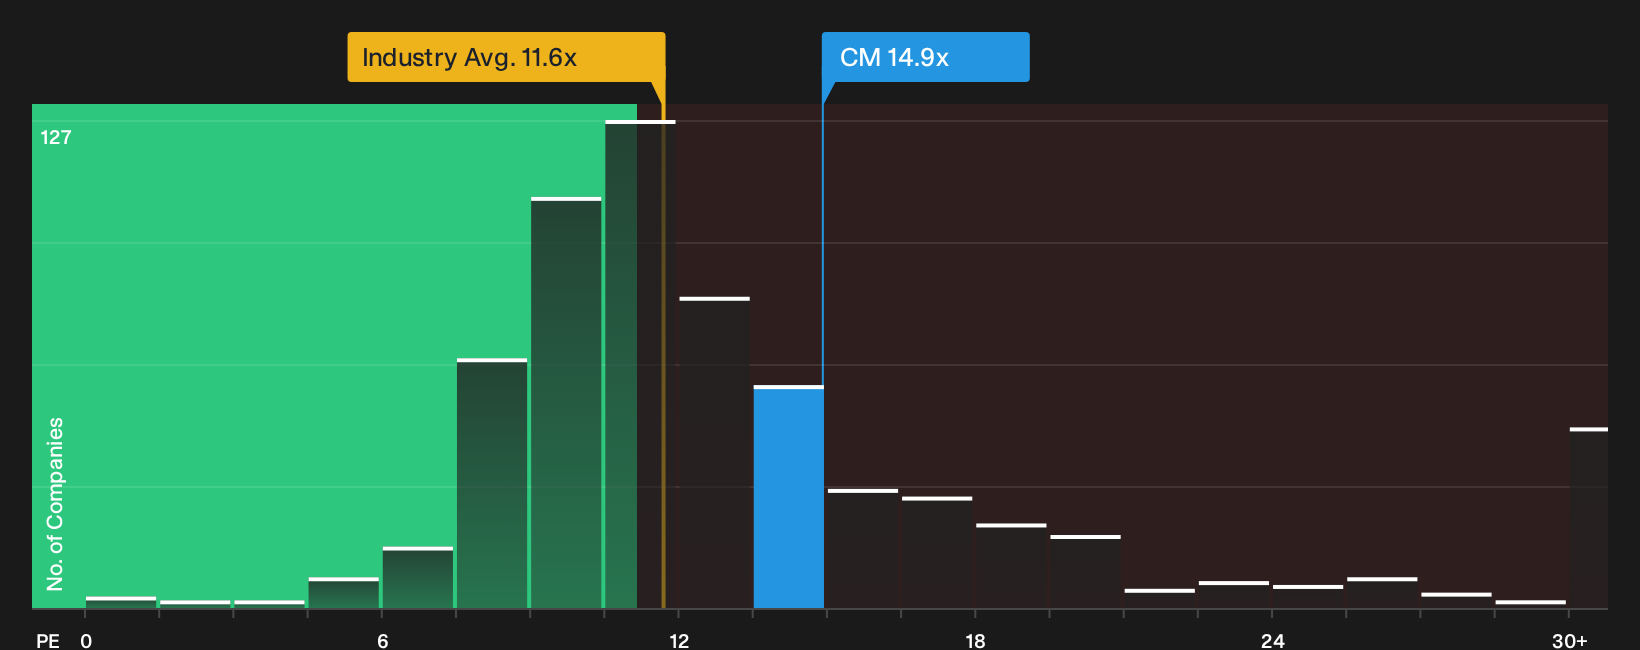
Multiples tell a different story for Canadian Imperial Bank of Commerce. The stock trades on a P/E of 14.9x, richer than the broader North American banks group at 11.6x, yet below an estimated fair ratio of 16.5x. This combination hints at both cushion and compression risk.
That gap suggests investors are paying more than the sector average for CM today, while still leaving room if sentiment moved toward the fair ratio. The key question is whether current earnings quality and growth justify paying a premium for this bank relative to peers.
See what the numbers say about this price — find out in our valuation breakdown.
Next Steps
If this bullish tilt on Canadian Imperial Bank of Commerce has you curious rather than convinced, move quickly to review the data and test it yourself. To see the optimistic factors already identified, review the 4 key rewards.
Looking for more investment ideas beyond Canadian Imperial Bank of Commerce?
If Canadian Imperial Bank of Commerce has sharpened your thinking, do not stop here. You can broaden your watchlist with targeted ideas that align with your risk and income goals.
- Target steadier potential outcomes by focusing on companies with healthier finances and resilient metrics using the 8 resilient stocks with low risk scores.
- Expand your income-oriented watchlist by concentrating on businesses that currently offer relatively stronger yields and consistent payouts through the 1 dividend fortresses.
- Explore underfollowed opportunities by tracking fundamentally solid companies that have not yet attracted broad attention via the 9 high quality undiscovered gems.
This article by Simply Wall St is general in nature. We provide commentary based on historical data and analyst forecasts only using an unbiased methodology and our articles are not intended to be financial advice. It does not constitute a recommendation to buy or sell any stock, and does not take account of your objectives, or your financial situation. We aim to bring you long-term focused analysis driven by fundamental data. Note that our analysis may not factor in the latest price-sensitive company announcements or qualitative material. Simply Wall St has no position in any stocks mentioned.
Have feedback on this article? Concerned about the content? Get in touch with us directly. Alternatively, email editorial-team@simplywallst.com