


Terex (TEX) is back in focus after fresh attention on its role supplying equipment for construction, infrastructure and recycling projects. This has prompted investors to reassess how the industrial manufacturer is currently priced.
Recent trading tells a mixed story. Terex shares have pulled back, with a 30-day share price return down 10.01% and a 90-day share price return down 14.58%. However, the year-to-date share price return is 3.40% and the 1-year total shareholder return is 7.46%, which hints at fading short term momentum against a still positive multi year record that includes a 5-year total shareholder return of 46.95%.
Scan beyond Terex and see how other industrial and infrastructure exposed stocks with solid fundamentals are setting up in the 39 power grid technology and infrastructure stocks.
Terex now trades at a sizeable discount to both analyst targets and intrinsic estimates after that pullback. Is this a cautious market correctly pricing risk, or an overly harsh markdown on a solid industrial operator?
Most Popular Narrative: 29% Undervalued
Terex is priced at $56.90 against a most-followed fair value estimate of $79.94, so the current gap really comes down to whether the business can deliver on the growth and margin story analysts have mapped out using a 9.44% discount rate.
The sustained increase in global infrastructure and manufacturing investment supported by policy incentives and federal construction allocations remains a live driver, with Terex now pointing to a Q2 2026 backlog of US$6.9b and upgraded 2026 sales guidance of US$7.9b to US$8.2b as indicators that this demand cycle could continue to support revenue growth and earnings.
See why 12 investors see Terex as 29% undervalued.
Result: Fair Value of $79.94 (UNDERVALUED)
Still, Terex faces two clear swing factors: any sustained pressure on segment margins, and a weaker Environmental Solutions outlook if refuse truck demand stays muted.
Find out about the key risks to this Terex narrative.
Another View On Terex Using Earnings Multiples
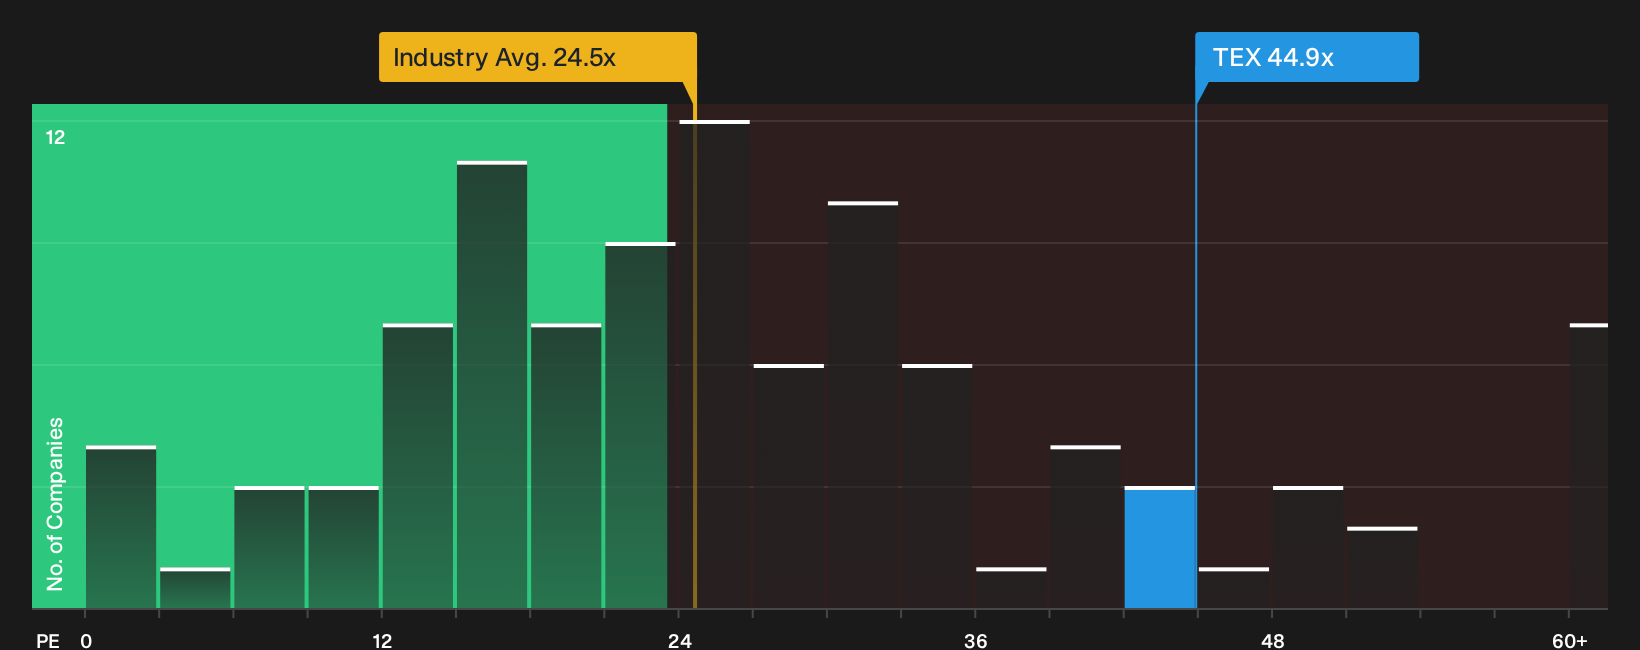
There is a catch to the 29% undervalued story. On a simple P/E comparison, Terex trades at 44.9x, which screens as expensive next to both its Machinery industry peers at 24.5x and the peer group average at 18.8x, even though the fair ratio for Terex is 63.1x.
That mix of a rich headline multiple against peers but a discount to the 63.1x fair ratio points to real valuation risk if growth or margins fall short, as well as potential upside if earnings land closer to the high quality expectations now baked in. Which side of that trade-off do you think is more likely for your own portfolio?
See what the numbers say about this price — find out in our valuation breakdown.
Next Steps
Mixed messages in the Terex story so far. Take a few minutes to review the data, consider both the potential risks and rewards, and then judge the balance of 3 key rewards and 3 important warning signs.
Looking for more Terex-size opportunities?
If Terex has you thinking harder about pricing power, do not stop here. Use the Simply Wall Street Screener to spot clear, data backed opportunities before they move.
- Target dependable value by scanning companies that combine quality fundamentals with appealing valuations through the 27 high quality undervalued stocks.
- Strengthen portfolio resilience by focusing on businesses with cleaner finances and sturdier funding profiles using the list of solid balance sheet and fundamentals (25 results).
- Hunt for future leaders early by tracking financially robust smaller players that many investors have not focused on yet in the 19 high quality undiscovered gems.
This article by Simply Wall St is general in nature. We provide commentary based on historical data and analyst forecasts only using an unbiased methodology and our articles are not intended to be financial advice. It does not constitute a recommendation to buy or sell any stock, and does not take account of your objectives, or your financial situation. We aim to bring you long-term focused analysis driven by fundamental data. Note that our analysis may not factor in the latest price-sensitive company announcements or qualitative material. Simply Wall St has no position in any stocks mentioned.
Have feedback on this article? Concerned about the content? Get in touch with us directly. Alternatively, email editorial-team@simplywallst.com