


Over the last 7 days, the United States market has risen by 1.6%, and over the past year, it has seen a 13% increase, with earnings anticipated to grow by 18% annually in the coming years. In such a robust market environment, identifying stocks that are trading below their intrinsic value can offer investors attractive opportunities for potential growth.
Top 10 Undervalued Stocks Based On Cash Flows In The United States
| Name | Current Price | Fair Value (Est) | Discount (Est) |
| Zions Bancorporation National Association (ZION) | $63.28 | $125.16 | 49.4% |
| Textron (TXT) | $75.75 | $146.79 | 48.4% |
| Provident Financial Services (PFS) | $22.38 | $43.18 | 48.2% |
| PPG Industries (PPG) | $105.27 | $202.16 | 47.9% |
| Northeast Bank (NBN) | $125.83 | $247.61 | 49.2% |
| M&T Bank (MTB) | $218.26 | $422.24 | 48.3% |
| KeyCorp (KEY) | $20.18 | $39.88 | 49.4% |
| Fulton Financial (FULT) | $22.69 | $44.83 | 49.4% |
| Civista Bancshares (CIVB) | $26.82 | $53.30 | 49.7% |
| Chagee Holdings (CHA) | $11.19 | $22.20 | 49.6% |
Let's uncover some gems from our specialized screener.
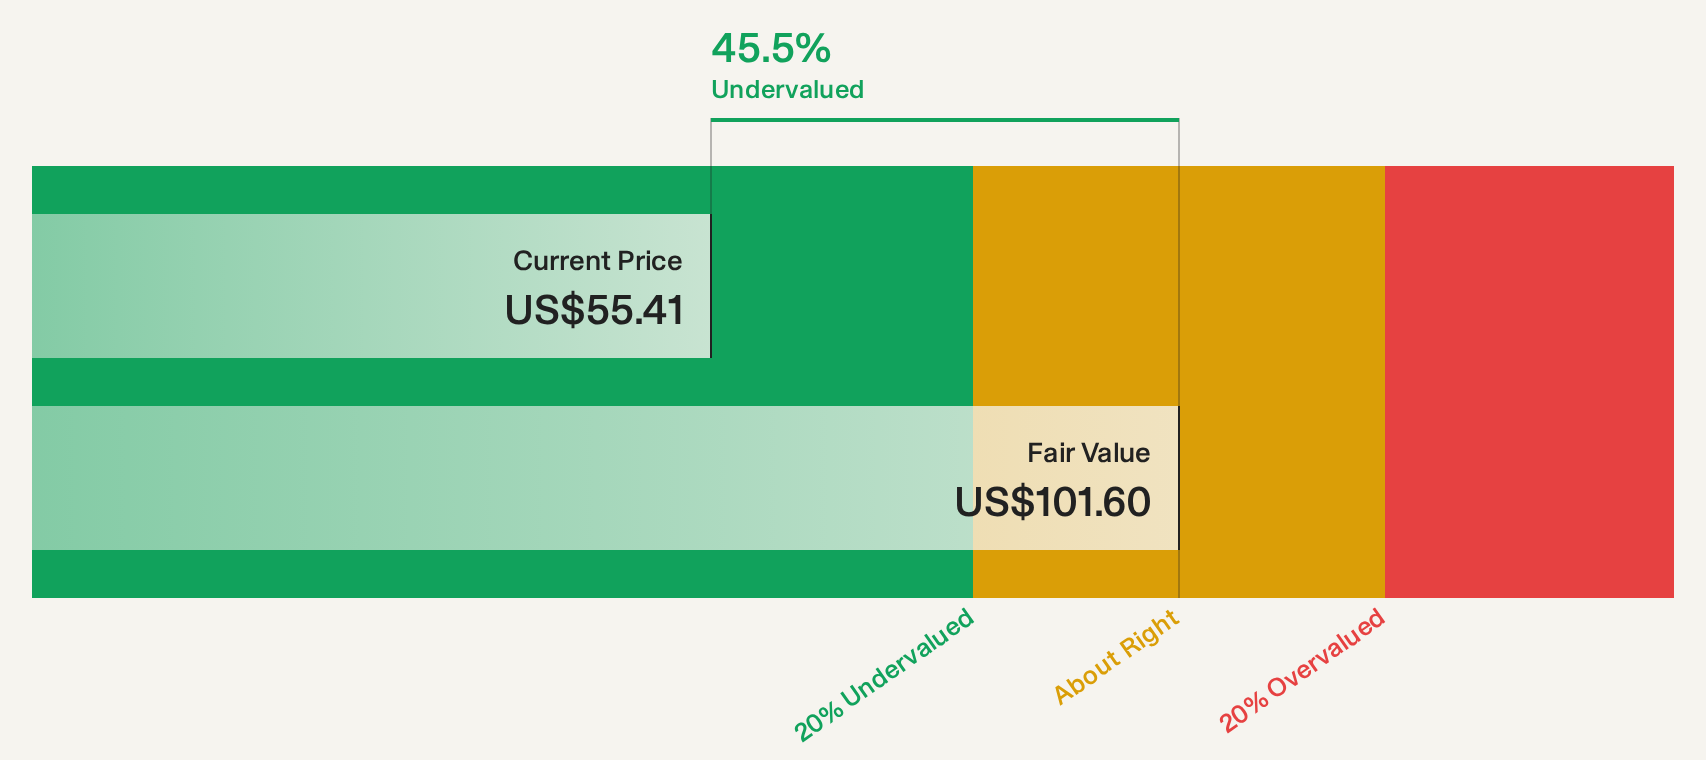
Baker Hughes (BKR)
Overview: Baker Hughes Company offers a range of technologies and services to the energy and industrial sectors, with a market cap of approximately $55.59 billion.
Operations: The company's revenue is derived from two main segments: Industrial & Energy Technology (IET), contributing $13.83 billion, and Oilfield Services & Equipment (OFSE), generating $13.90 billion.
Estimated Discount To Fair Value: 46.3%
Baker Hughes is trading at US$57.38, significantly below its estimated cash flow value of US$106.8, suggesting undervaluation based on cash flows. Although revenue growth is forecasted at 7.8% annually, below the market average, strategic alliances and substantial contracts in LNG and natural gas sectors bolster its industrial portfolio and future prospects. Recent partnerships with New Stratus Energy and PDVSA enhance resource recovery capabilities and infrastructure expansion efforts in oil and gas markets.
- Insights from our recent growth report point to a promising forecast for Baker Hughes' business outlook.
- Click to explore a detailed breakdown of our findings in Baker Hughes' balance sheet health report.
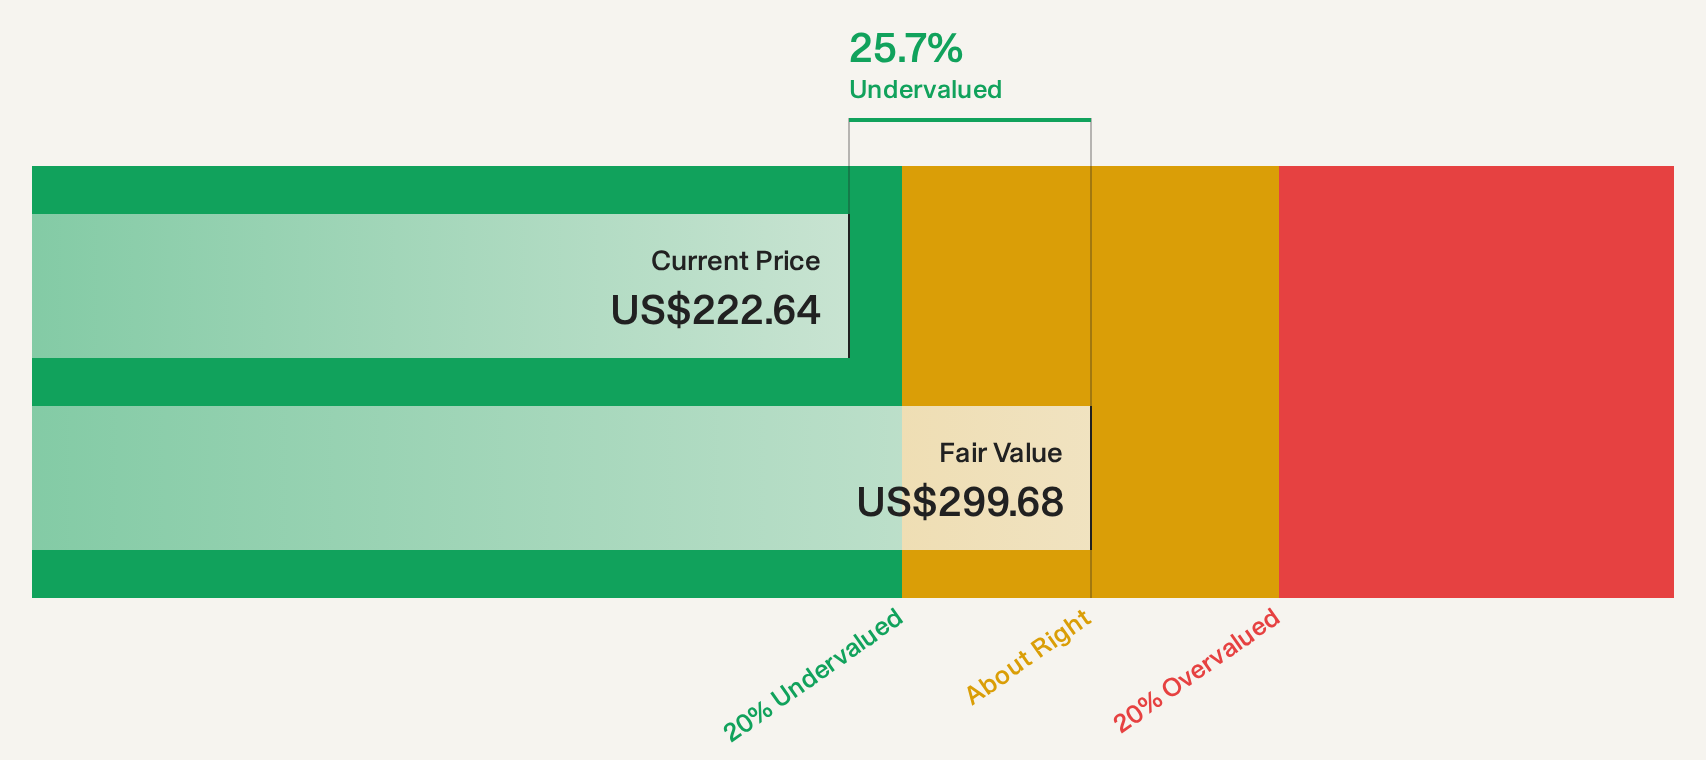
J.B. Hunt Transport Services (JBHT)
Overview: J.B. Hunt Transport Services, Inc. offers surface transportation, delivery, and logistics services across the United States with a market cap of $21.99 billion.
Operations: The company's revenue segments include Truckload at $835.40 million, Intermodal at $6.33 billion, Final Mile Services at $798.80 million, Integrated Capacity Solutions at $1.29 billion, and Dedicated Contract Services (excluding FMS) at $3.47 billion.
Estimated Discount To Fair Value: 24.4%
J.B. Hunt Transport Services is trading at US$229.74, below its estimated cash flow value of US$304, indicating potential undervaluation based on cash flows. Recent earnings show a strong performance with net income rising to US$181.03 million in Q2 2026 from US$128.62 million a year ago, despite revenue growth forecasts trailing the market average. The company also completed a share buyback worth US$209.83 million, enhancing shareholder value amidst slower expected revenue growth compared to the broader market.
- Our earnings growth report unveils the potential for significant increases in J.B. Hunt Transport Services' future results.
- Navigate through the intricacies of J.B. Hunt Transport Services with our comprehensive financial health report here.
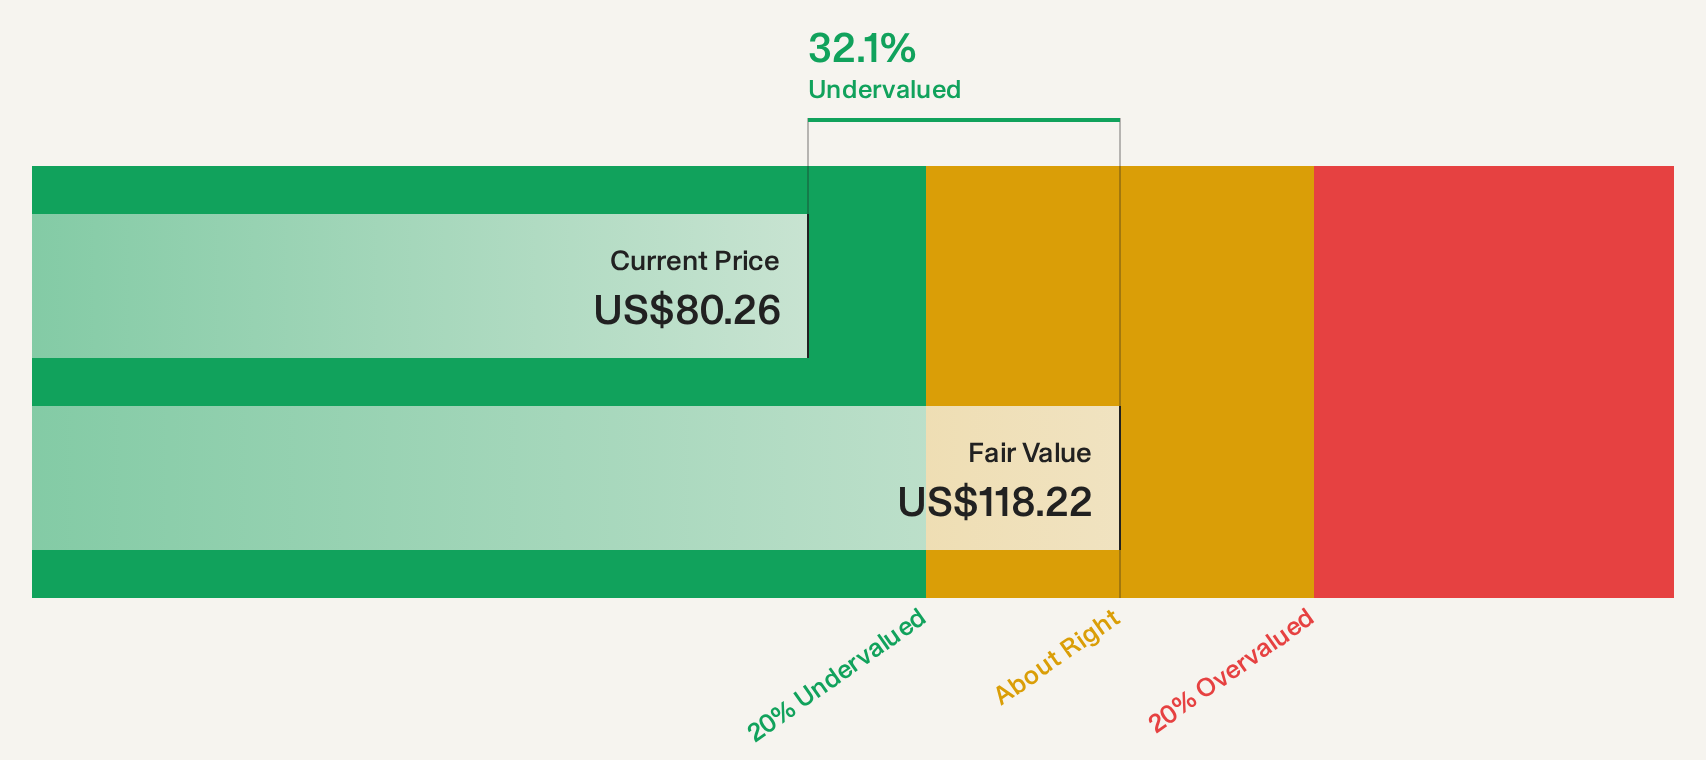
Wells Fargo (WFC)
Overview: Wells Fargo & Company is a financial services firm offering a wide range of banking, investment, mortgage, and finance products both in the U.S. and internationally, with a market cap of approximately $243.28 billion.
Operations: The company generates revenue through several segments, including Consumer Banking and Lending ($35.14 billion), Corporate and Investment Banking ($20.23 billion), Wealth and Investment Management ($17.27 billion), and Commercial Banking ($11.93 billion).
Estimated Discount To Fair Value: 32.2%
Wells Fargo is trading at $81.44, significantly below its estimated cash flow value of $120.2, highlighting potential undervaluation based on cash flows. Despite a forecasted earnings growth of 4.43% annually, which lags the broader U.S. market's expected growth rate, Wells Fargo maintains a competitive valuation relative to peers and industry standards. Recent fixed-income offerings and strategic initiatives like the "Get Money Ready" platform underscore efforts to bolster financial resilience and customer engagement amidst slower revenue growth projections.
- Upon reviewing our latest growth report, Wells Fargo's projected financial performance appears quite optimistic.
- Take a closer look at Wells Fargo's balance sheet health here in our report.
Make It Happen
- Get an in-depth perspective on all 104 Undervalued US Stocks Based On Cash Flows by using our screener here.
- Are you invested in these stocks already? Keep abreast of every twist and turn by setting up a portfolio with Simply Wall St, where we make it simple for investors like you to stay informed and proactive.
- Discover a world of investment opportunities with Simply Wall St's free app and access unparalleled stock analysis across all markets.
Looking For Alternative Opportunities?
- Explore high-performing small cap companies that haven't yet garnered significant analyst attention.
- Diversify your portfolio with solid dividend payers offering reliable income streams to weather potential market turbulence.
- Fuel your portfolio with companies showing strong growth potential, backed by optimistic outlooks both from analysts and management.
This article by Simply Wall St is general in nature. We provide commentary based on historical data and analyst forecasts only using an unbiased methodology and our articles are not intended to be financial advice. It does not constitute a recommendation to buy or sell any stock, and does not take account of your objectives, or your financial situation. We aim to bring you long-term focused analysis driven by fundamental data. Note that our analysis may not factor in the latest price-sensitive company announcements or qualitative material. Simply Wall St has no position in any stocks mentioned.
Have feedback on this article? Concerned about the content? Get in touch with us directly. Alternatively, email editorial-team@simplywallst.com