


Suzuki Motor (TSE:7269) has announced a reshuffle in its manufacturing leadership following the resignation of Whole-time Director and Director of Production, Kazunari Yamaguchi, who will move to a non-executive role.
For shareholders, Suzuki Motor’s 7 day share price return of 3.03% contrasts with a decline of 16.77% year to date. The 5 year total shareholder return of 77.18% points to a much stronger long run record than the recent pullback and may explain why leadership shifts in production are under close scrutiny as investors reassess execution risk and future manufacturing efficiency.
Scan other auto manufacturers facing similar production and efficiency pressures with our curated list of list of solid balance sheet and fundamentals (23 results) that investors are watching alongside Suzuki Motor.
Suzuki Motor now pairs a sharp year to date pullback with a long run gain that is still intact. Does that mix of pressure and history leave the current valuation skewed toward buyers or toward caution?
Price-to-Earnings of 7.4x: Is it justified?
Valuation on Suzuki Motor looks compressed, with a P/E of 7.4x at a last close of ¥1,990.5 while several measures point to the shares trading at a discount to peers and internal fair value estimates.
The P/E ratio compares the current share price with earnings per share and gives a quick sense of how much investors are paying for each unit of profit. For a mature auto manufacturer like Suzuki Motor, this metric is often a primary yardstick because profits tend to be relatively established and investors can weigh current earnings against production risks, leadership changes and capital intensity.
On multiple fronts, the market is assigning a lower price tag to these earnings than to similar businesses. The stock is described as trading at good value compared to peers and the wider auto industry, with its 7.4x P/E below the Asian Auto average of 13.5x and also under the peer group average of 11.2x. Internal modelling suggests a fair P/E closer to 12.5x, which is materially higher than where the shares trade today and could be a level investors look toward if sentiment on execution and returns normalises.
Result: Price-to-Earnings of 7.4x (UNDERVALUED)
Explore the SWS fair ratio for Suzuki Motor.Still, Suzuki Motor faces clear risks if production issues linger or leadership changes slow decisions. These factors could keep pressure on earnings quality and investor confidence.
Find out about the key risks to this Suzuki Motor narrative.
Another view on Suzuki Motor’s value
The SWS DCF model paints a similar picture to the low P/E. At ¥1,990.5, Suzuki Motor trades about 5.8% below an estimated future cash flow value of ¥2,113.2, which again tilts the story toward undervaluation. Does that alignment give you confidence, or does it make you question what risk the market is still pricing in?
Look into how the SWS DCF model arrives at its fair value.
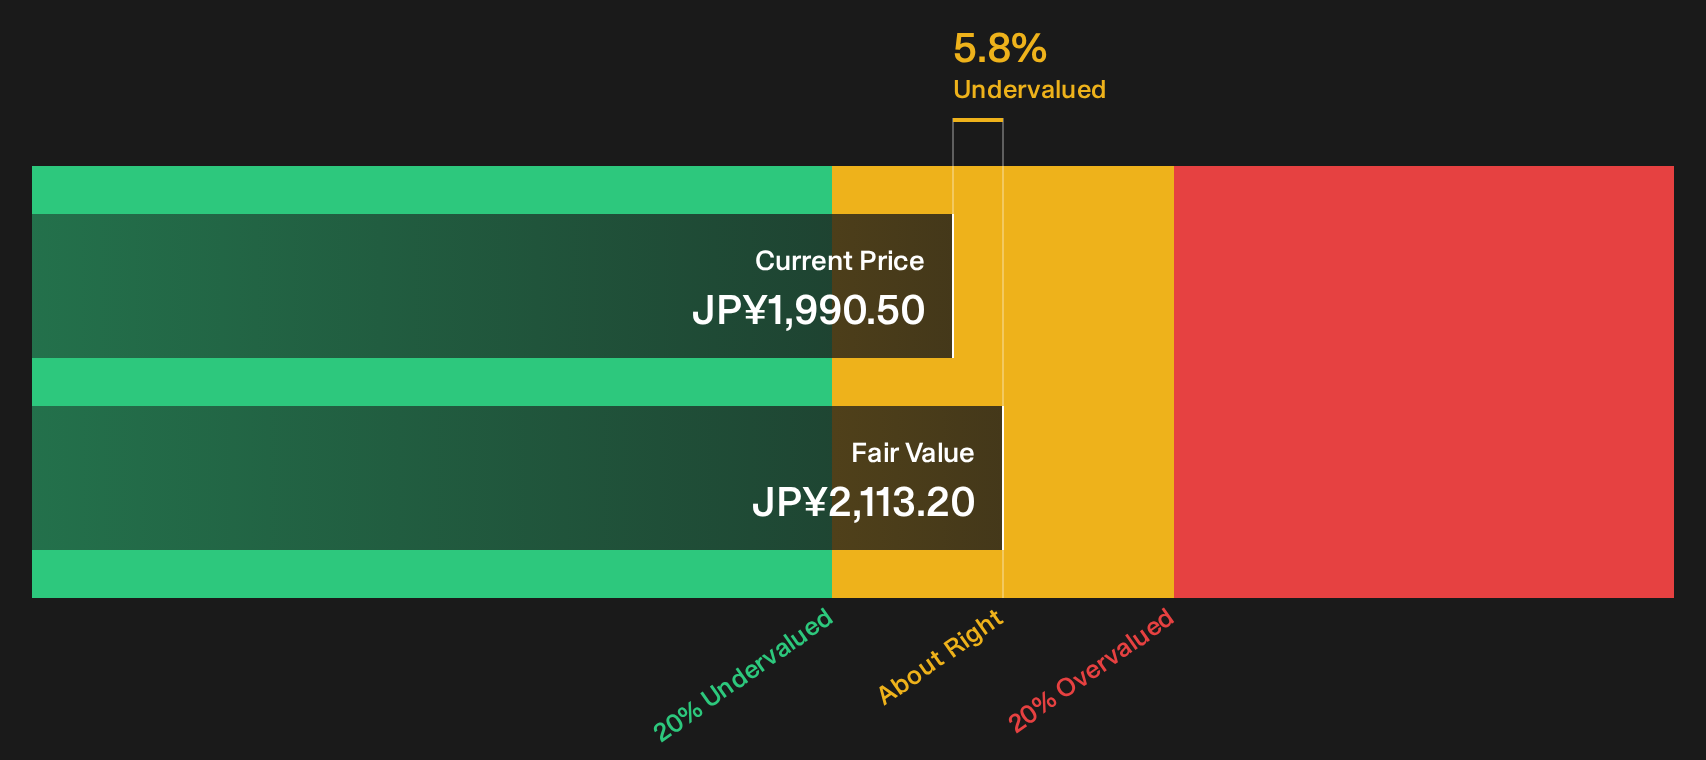
Simply Wall St performs a discounted cash flow (DCF) on every stock in the world every day (check out Suzuki Motor for example). We show the entire calculation in full. You can track the result in your watchlist or portfolio and be alerted when this changes, or use our stock screener to discover 14 high quality undervalued stocks. If you save a screener we even alert you when new companies match - so you never miss a potential opportunity.
Next Steps
Sentiment around Suzuki Motor may feel mixed after the leadership reshuffle and valuation debate, so consider acting promptly and testing the numbers against your own expectations. To see what optimistic investors are focusing on, start with its 5 key rewards.
Looking for more investment ideas beyond Suzuki Motor?
Once you have a view on Suzuki Motor, widen your opportunity set with a few focused stock lists that can help you spot conditions that better match your approach.
- Target stronger balance sheets and steadier financial profiles by scanning a curated list of solid balance sheet and fundamentals (23 results) that can complement or contrast your view on Suzuki Motor.
- Hunt for value driven setups using a focused pool of 14 high quality undervalued stocks where pricing and fundamentals line up in a way that might suit long term investors.
- Zero in on underfollowed potential by checking a hand picked mix of 75 high quality undiscovered gems that many portfolios may not yet have on the radar.
This article by Simply Wall St is general in nature. We provide commentary based on historical data and analyst forecasts only using an unbiased methodology and our articles are not intended to be financial advice. It does not constitute a recommendation to buy or sell any stock, and does not take account of your objectives, or your financial situation. We aim to bring you long-term focused analysis driven by fundamental data. Note that our analysis may not factor in the latest price-sensitive company announcements or qualitative material. Simply Wall St has no position in any stocks mentioned.
Have feedback on this article? Concerned about the content? Get in touch with us directly. Alternatively, email editorial-team@simplywallst.com