


The Zhitong Finance App learned that CITIC Construction Investment released a research report saying that the turnover rate: the A-share turnover rate declined further in September, the market had a strong wait-and-see mentality before the Federal Reserve's interest rate meeting. Market trading was deserted before the Mid-Autumn Festival National Day holiday. The market eventually shrank for three consecutive months, and volume energy was close to the lowest level since this round of the bull market. New volume of partial equity funds: The volume of new partial equity funds improved slightly and rebounded slightly in September. Overall, it is at a low level, and individual investors' confidence is still insufficient. Share of financing purchases: The indicator continued to decline in the first half of September, then rebounded once in the second half of the month, but fell again and fell to around 8.4% at the end of the month. It can be seen that although there has been a phased improvement in leveraged capital sentiment, the sentiment is still not high, and we still need to be wary of the risk of a decline in the future. The implied risk premium indicator rose slightly in September, from 2.81% at the beginning of the month to 3.05% at the end of the month, indicating that the cost performance ratio of equity assets is improving. Poor return on equity bonds: The indicator quickly declined to negative in early September. Since then, it has basically been below the zero axis, which means that the current profit effect is poor. Over 60MA: From August 5 to now, the indicator has basically fluctuated in a narrow range between 28% and 34%, and dropped to around 28% again at the end of September, which means that the market is still weak in the medium to long term. Overbought and oversold: Since the beginning of August, the indicator has been below the zero axis for a long time. The market has fluctuated downward, and there is insufficient momentum to rebound from the overfall.
CITIC Construction Investment's main views are as follows:
At the end of March 2022, we launched the CITIC Construction Investment Strategy - Investor Sentiment Index, which is a synthesis of multiple market open trading indicators. The index well reflects the level of market sentiment at the time in important ranges of the A-share market history, and its extremely high and extremely low points can be ahead of market reversals, and has certain predictive ability. It should be pointed out that the index is used to portray investor sentiment in the market. It is a synchronous indicator, and its predictability is mainly reflected in the predictability of investor sentiment about the market. Since the launch of the Investor Sentiment Index, it has received a large number of investors' attention, so starting at the end of April 2022, we will track and display the current market sentiment in the form of monthly reports, and present the historical trends and latest trends of the sub-core sentiment indicators. In August 2024, we launched another special report, reviewing the actual results of market timing selection in the past two and a half years since the Sentiment Index was released, and summarizing the performance of different market styles in different emotional states.
Looking at the A-share market before the holiday from an emotional perspective
In the August Market Sentiment Tracking Report, we pointed out that “the current market sentiment is at a median-high level, but due to obvious financial constraints, it is difficult to form an overall upward trend. It is expected that the medium volatile market will still be the main trend.” The market fluctuated and declined in September, and the Wandequan A Index fell 5.31%, verifying our earlier views. In particular, the Wandequan A Index fell 4.92% on the three trading days of September 23-28, contributing to most of the decline in September. Judging from the time of the sentiment index, what are the characteristics of the A-share market before the National Day?
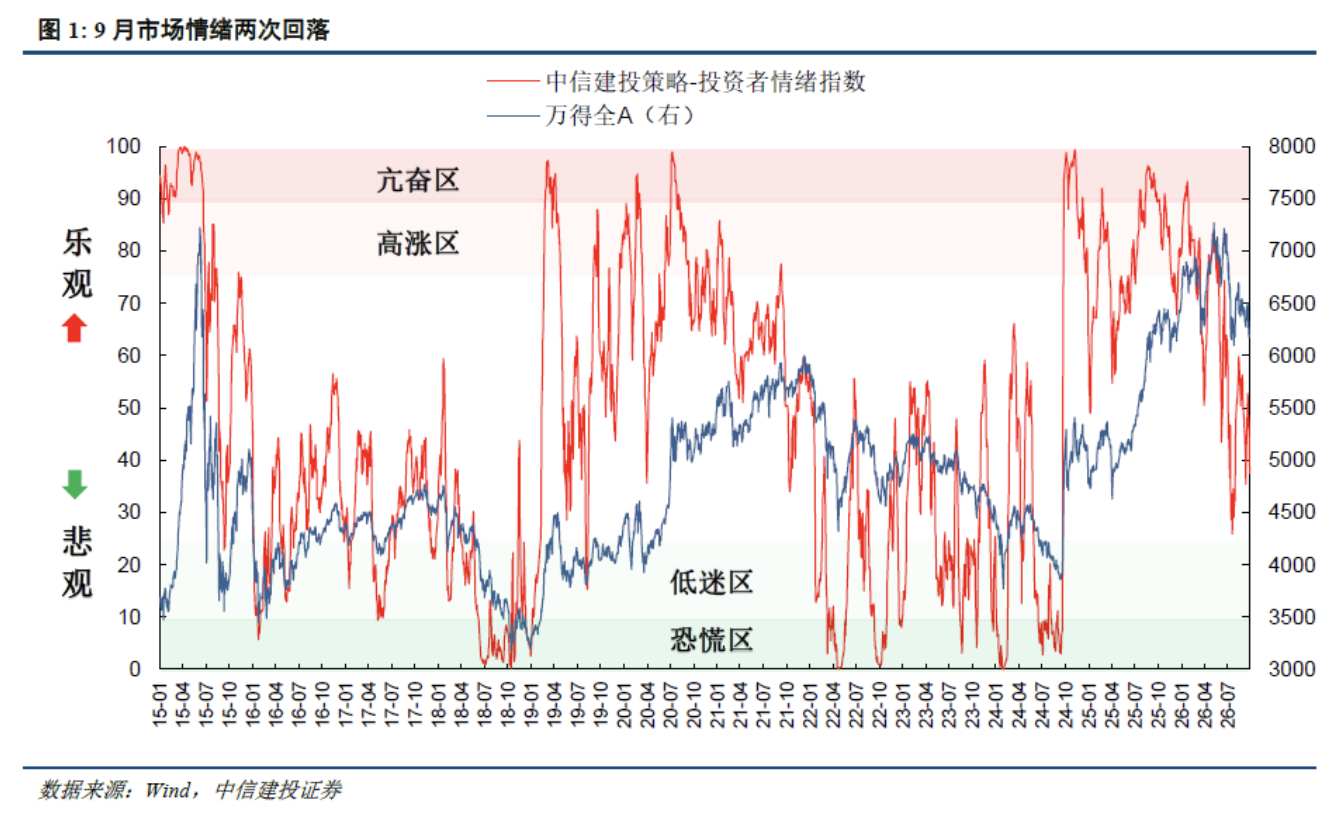
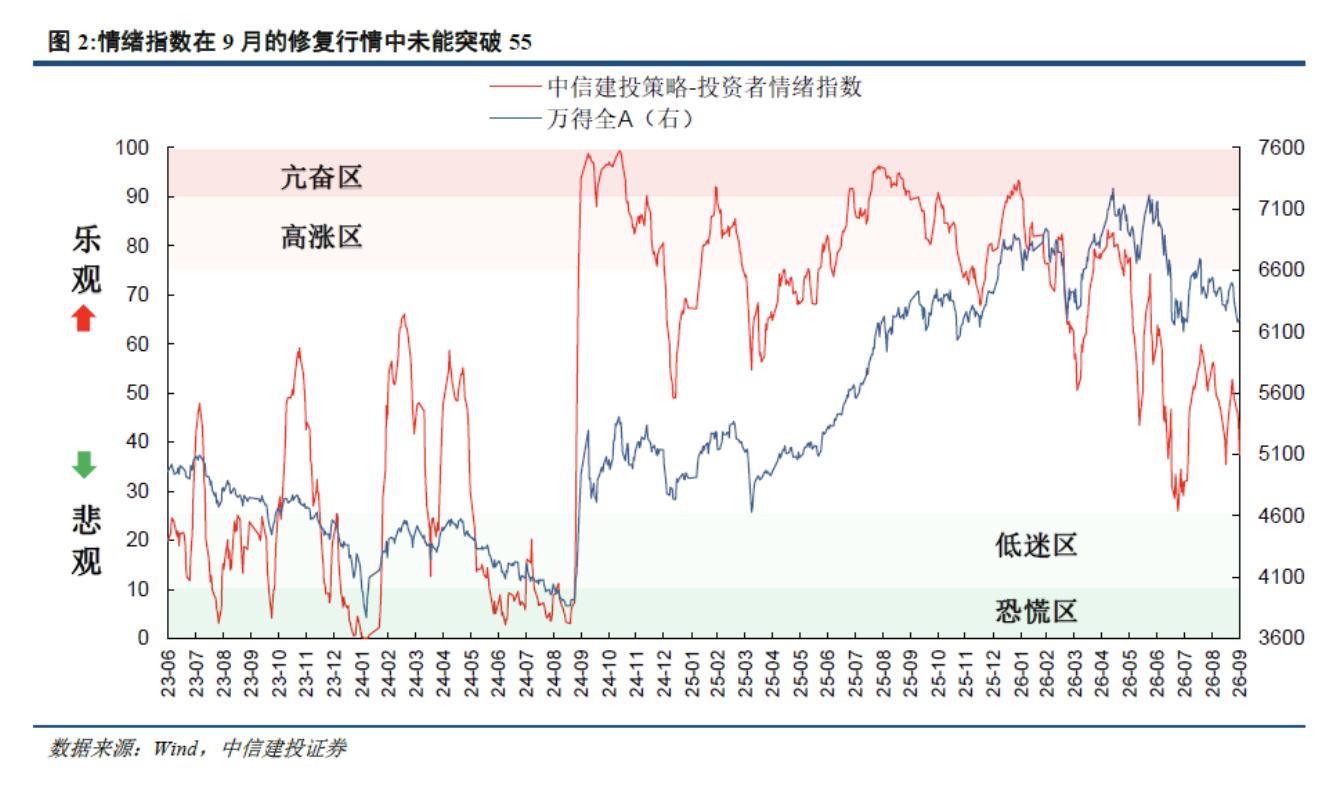
The market continued to weaken in September, and the sentiment index continued to decline in the first half of the month. After falling to a low of around 35 on September 15, the market began to recover. However, after rising to around 52 on September 22, the sentiment index fell again. It failed to break through 55. It even quickly fell below 50, and fell below 38 again at the end of the month. Looking at the short term, the obvious contraction of the market before the National Day and the decline in sentiment is in line with seasonal effects. Post-holiday sentiment is expected to pick up and repair the market will begin (see “Investor Sentiment Index's Practical Battle for A-Shares: Market Timing and Style Research” for details of seasonal effect statistics). From a long-term perspective, compared to the August sentiment index, which failed to break through 55, immediately began to decline, leading to a further decline in the high point of the sentiment index. In the future, we need to be wary of the incremental capital stock game. We can observe whether the post-holiday mood index can break through 55 and rise to the 60-65 range.
We analyze each sub-indicator. Among the seven major indicators, the turnover rate, partial share fund issuance volume, share of financing purchases, implied risk premium, and stock bond yield spread data smoothed over the 5-day average; the two indicators of over 60MA and overbought and oversold were originally weekly data. In order to be more sensitive and now unified on a daily basis, the 60-week EMA was essentially changed to the 300-day EMA. The following are all using this caliber by default.
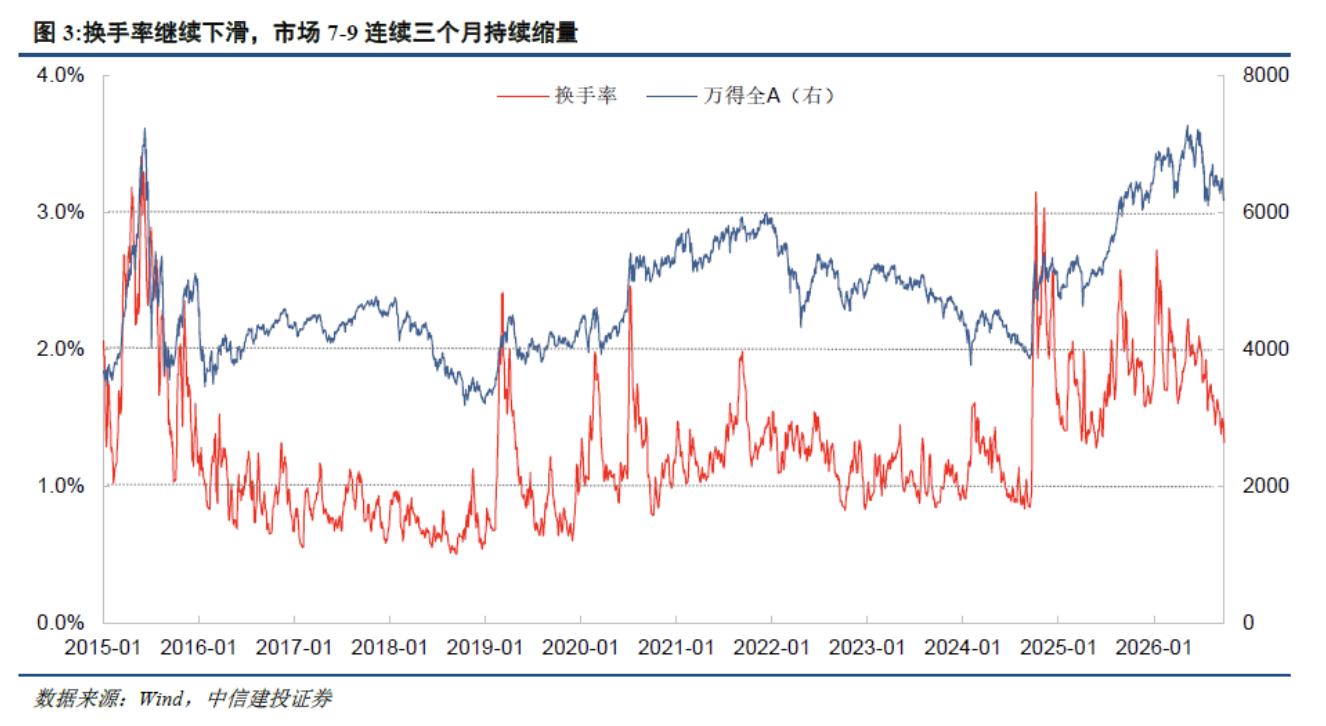
Turnover rate: The turnover rate continued to decline, and the market continued to shrink for 7-9 consecutive months. The A-share turnover rate declined further in September. The market had a strong wait-and-see mentality before the Federal Reserve's interest rate meeting. Market trading was deserted before the Mid-Autumn Festival National Day holiday. The market eventually shrank for three consecutive months, and the volume was close to the lowest level since this round of the bull market.
New volume of partial equity funds: There was a slight recovery in September, and overall it is still at a low level. The volume of new equity funds improved slightly and rebounded slightly in September. Overall, it is at a low level, and individual investor confidence is still insufficient.
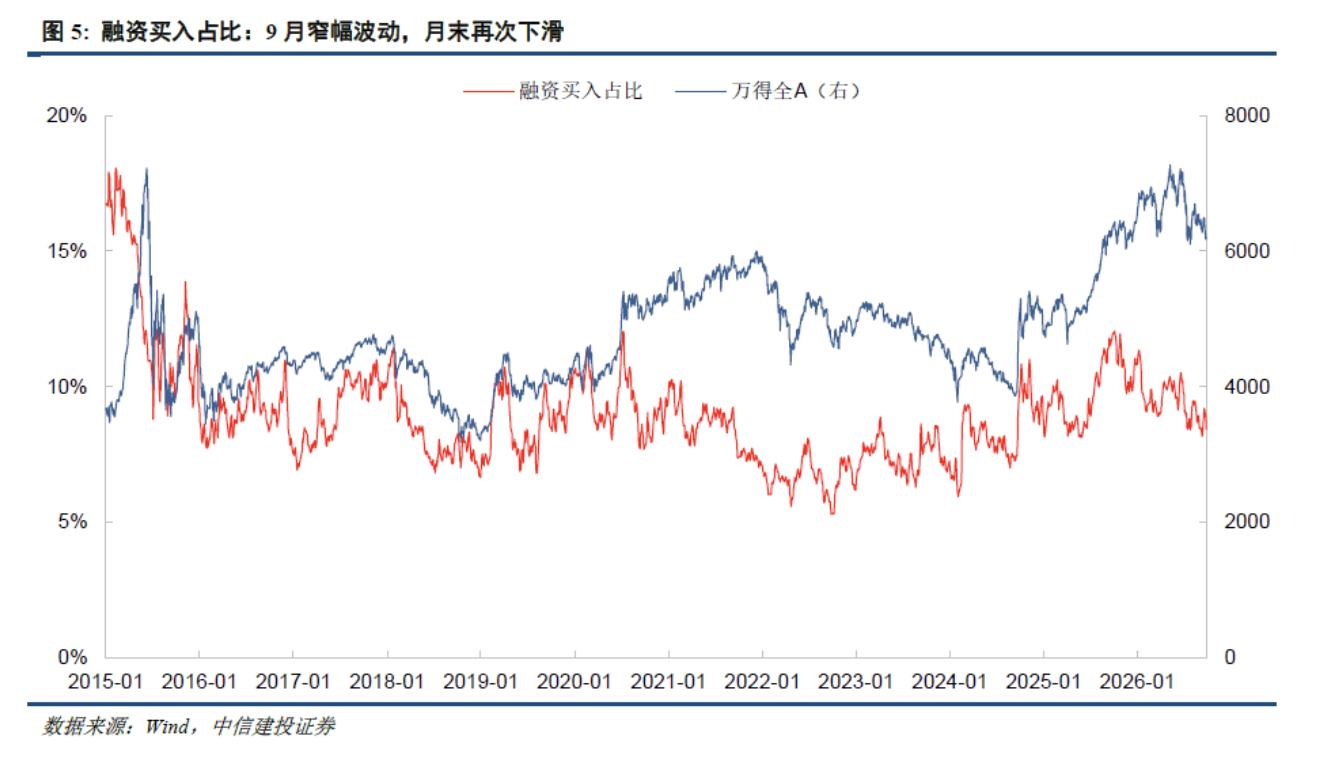
The share of financing purchases: It fluctuated narrowly in September and declined again at the end of the month. The share of financing purchases continued to decline in the first half of September. It rebounded once in the second half of the month, but declined again and fell to around 8.4% at the end of the month. It can be seen that although there has been a phased improvement in leveraged capital sentiment, the sentiment is still not high, and we still need to be wary of the risk of a decline in the future.
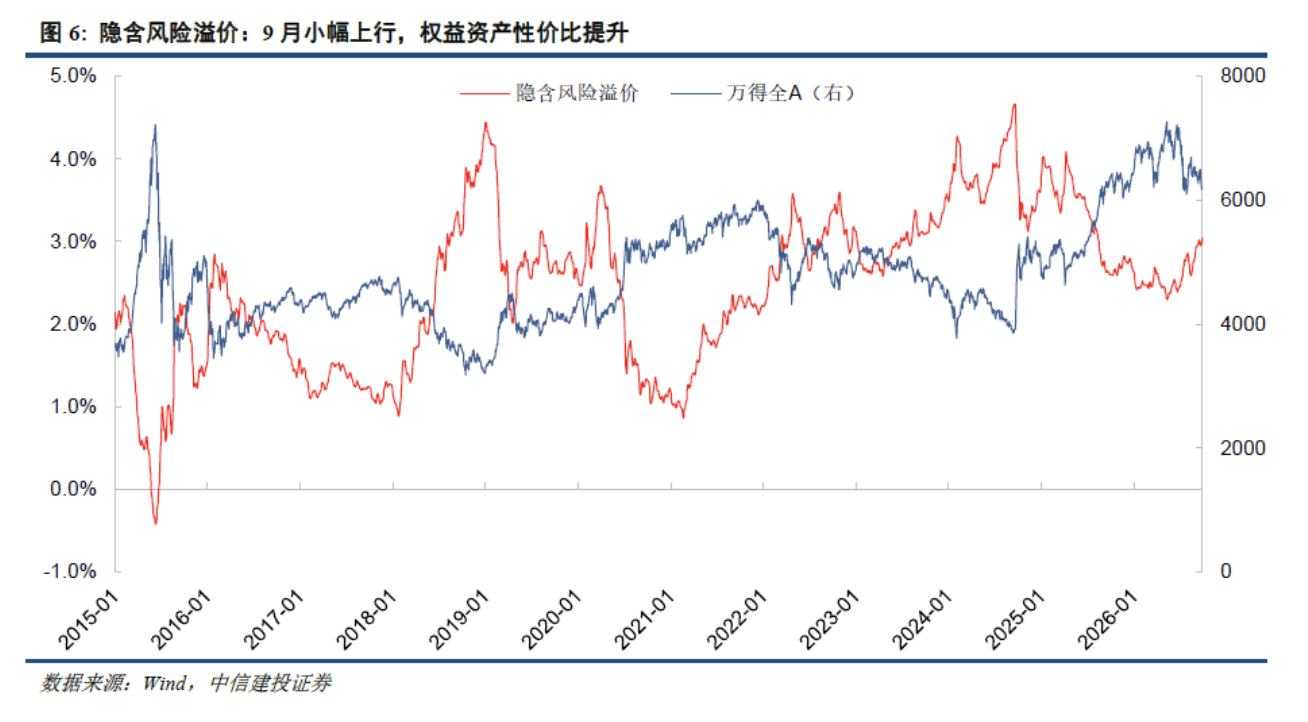
Implied risk premium: There was a slight increase in September, and the cost performance ratio of equity assets improved. The indicator rose slightly in September, from 2.81% at the beginning of the month to 3.05% at the end of the month, indicating that the cost performance ratio of equity assets is improving.
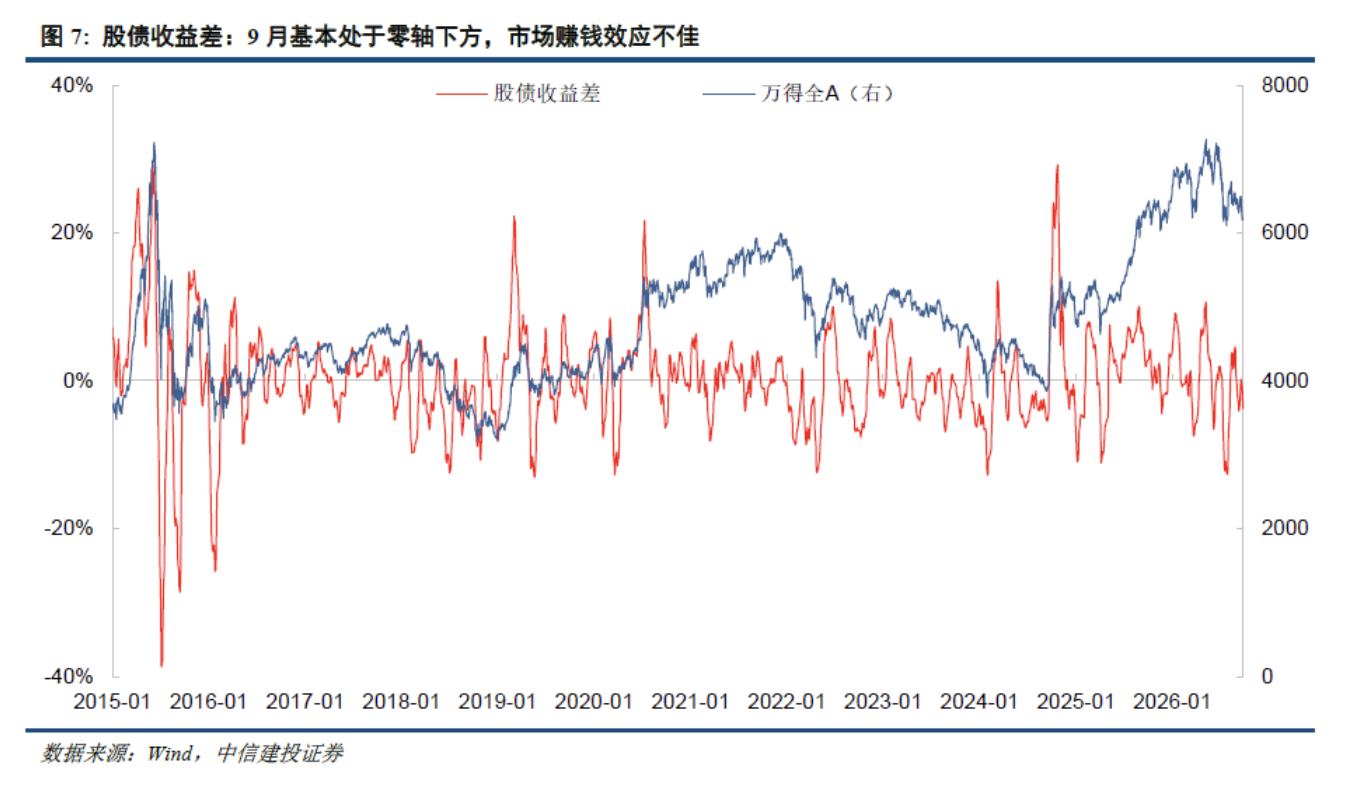
Poor return on equity bonds: September was basically below the zero axis, and the money-making effect on the market was poor. The indicators quickly declined and turned negative in early September. Since then, they have basically been below the zero axis, which means that the current profit effect is poor.
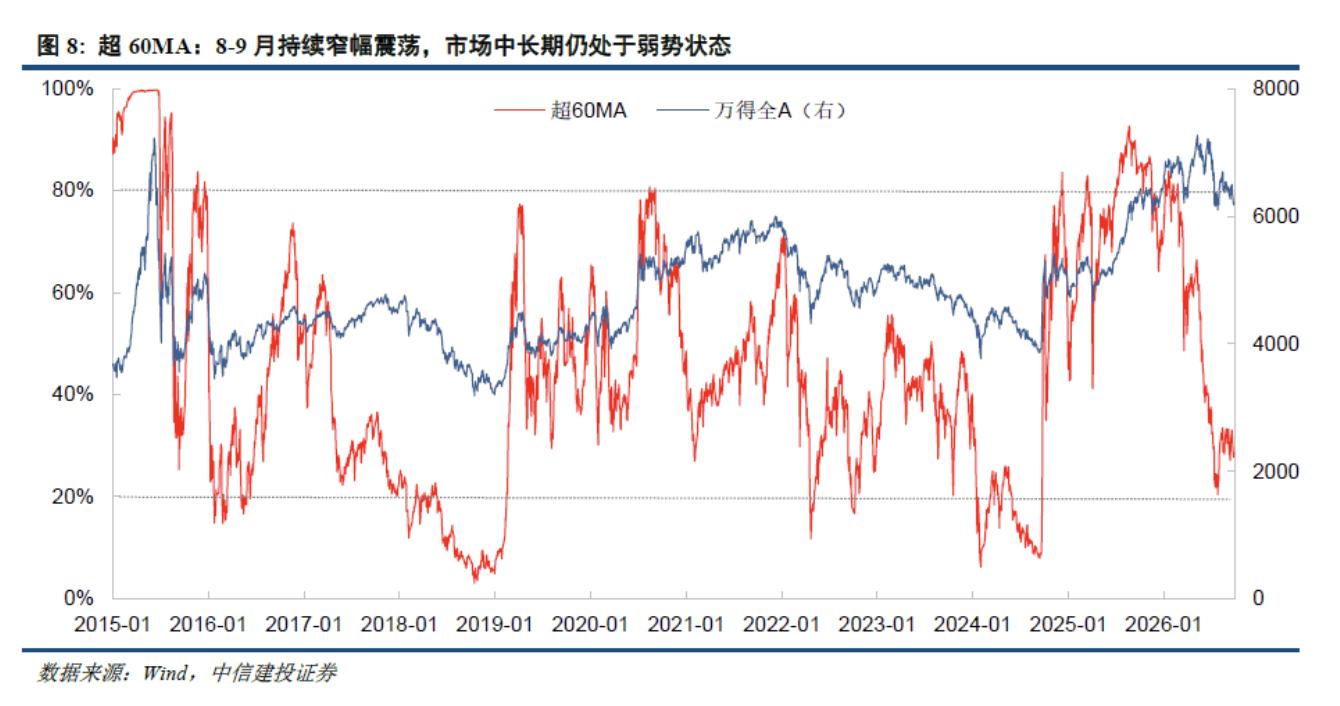
Over 60MA: Continued to fluctuate in a narrow range from August to September, and the market is still weak in the medium to long term. The indicator depicts the strength and weakness of the market from a medium- to long-term perspective, reflecting the proportion of individual stocks with closing prices above the 60-week EMA (300-day EMA) in the market. Historically, this indicator above 80%/below 20% often means that market sentiment is overheating/cooling, and there is a possibility that the market will reverse. Since August 5, the indicators have basically fluctuated in a narrow range between 28% and 34%, and fell to around 28% again at the end of September, which means that the market is still weak in the medium to long term.
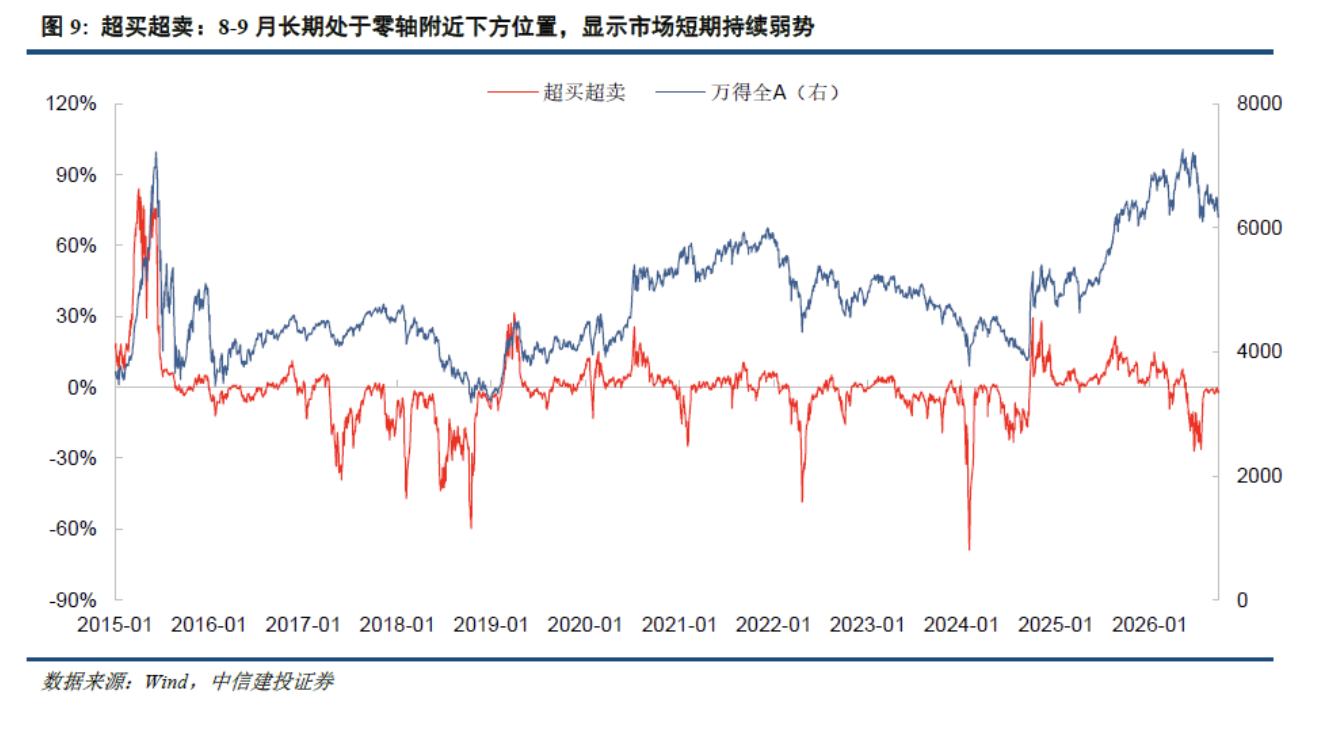
Overbought and oversold: The market remained below the zero axis for a long time in August-September, indicating that the market continues to weaken in the short term. The indicator depicts the strength and weakness of the market from a short-term perspective. Since the beginning of August, the indicator has been below the zero axis for a long time, and the market has fluctuated downward, and there is insufficient momentum for a rebound over the fall.
Risk Alerts
1) Data statistics are erroneous: The report data is exported from third-party databases such as Wind, and there may be discrepancies between third-party databases; there is also a possibility that the data may fluctuate due to statistical time issues; since the latest one-day fund issuance data has not yet been published, we have estimated this, and there may be errors compared to the actual value.
2) The model is based on historical data and has limited ability to predict the future: data statistics are lagging and may affect analysis results. The model is based on statistics and analysis of A-share historical data in recent years, and the ability to predict the future is limited; market sentiment may also be affected by policies and other unpredictable events.