


As Asian markets navigate a landscape marked by fluctuating bond yields and evolving economic policies, investors are increasingly focused on identifying opportunities amid the volatility. In this context, undervalued stocks present intriguing prospects for those seeking to capitalize on potential market inefficiencies and long-term growth potential.
Top 10 Undervalued Stocks Based On Cash Flows In Asia
| Name | Current Price | Fair Value (Est) | Discount (Est) |
| Woori Financial Group (KOSE:A316140) | ₩33400.00 | ₩66013.77 | 49.4% |
| Shanghai Flyco Electrical Appliance (SHSE:603868) | CN¥31.09 | CN¥61.58 | 49.5% |
| Riken Technos (TSE:4220) | ¥2408.00 | ¥4809.63 | 49.9% |
| Rakus (TSE:3923) | ¥1047.00 | ¥2070.20 | 49.4% |
| Nissui (TSE:1332) | ¥1104.00 | ¥2180.59 | 49.4% |
| Hainan Jinpan Smart Technology (SHSE:688676) | CN¥61.53 | CN¥121.93 | 49.5% |
| ENN Energy Holdings (SEHK:2688) | HK$48.96 | HK$96.85 | 49.4% |
| BuySell TechnologiesLtd (TSE:7685) | ¥2812.00 | ¥5549.67 | 49.3% |
| APAC Realty (SGX:CLN) | SGD0.52 | SGD1.03 | 49.7% |
| AK Medical Holdings (SEHK:1789) | HK$4.75 | HK$9.49 | 49.9% |
Here's a peek at a few of the choices from the screener.
Spark New Zealand (NZSE:SPK)
Overview: Spark New Zealand Limited, along with its subsidiaries, operates as a telecommunications company in New Zealand with a market cap of NZ$3.73 billion.
Operations: The company's revenue is derived from various segments, including Mobile at NZ$1.52 billion, Broadband at NZ$596 million, Procurement and Partners at NZ$563 million, Other Connectivity at NZ$327 million, Cloud services generating NZ$233 million, Voice services contributing NZ$126 million, and IT Services Management adding NZ$104 million.
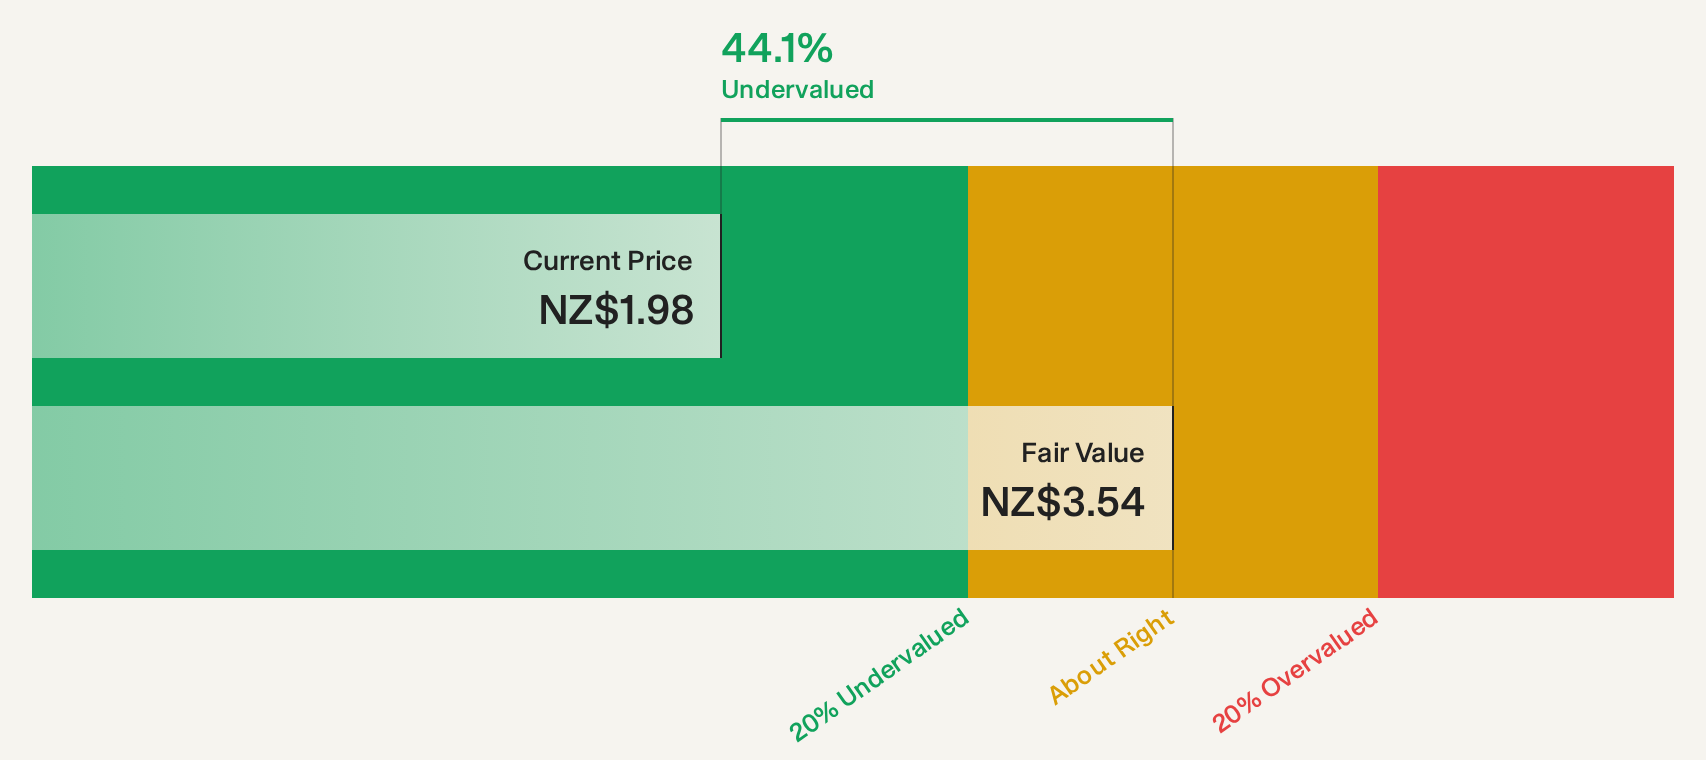
Estimated Discount To Fair Value: 44.3%
Spark New Zealand is trading at NZ$1.98, significantly below its estimated future cash flow value of NZ$3.54, indicating it may be undervalued based on cash flows. Despite a high debt level and forecasted declines in revenue and earnings over the next three years, Spark's recent earnings report showed improved net income at NZ$499 million. The company is undergoing strategic restructuring to focus on core connectivity services while reviewing its Digital Services division for potential enhancements in shareholder value.
- Our comprehensive growth report raises the possibility that Spark New Zealand is poised for substantial financial growth.
- Delve into the full analysis health report here for a deeper understanding of Spark New Zealand.
Sankyu (TSE:9065)
Overview: Sankyu Inc. offers logistics services both in Japan and internationally, with a market cap of ¥397.63 billion.
Operations: The company's revenue is primarily derived from its Logistics Business, which accounts for ¥300.04 billion, and its Machinery Business, contributing ¥311.45 billion.
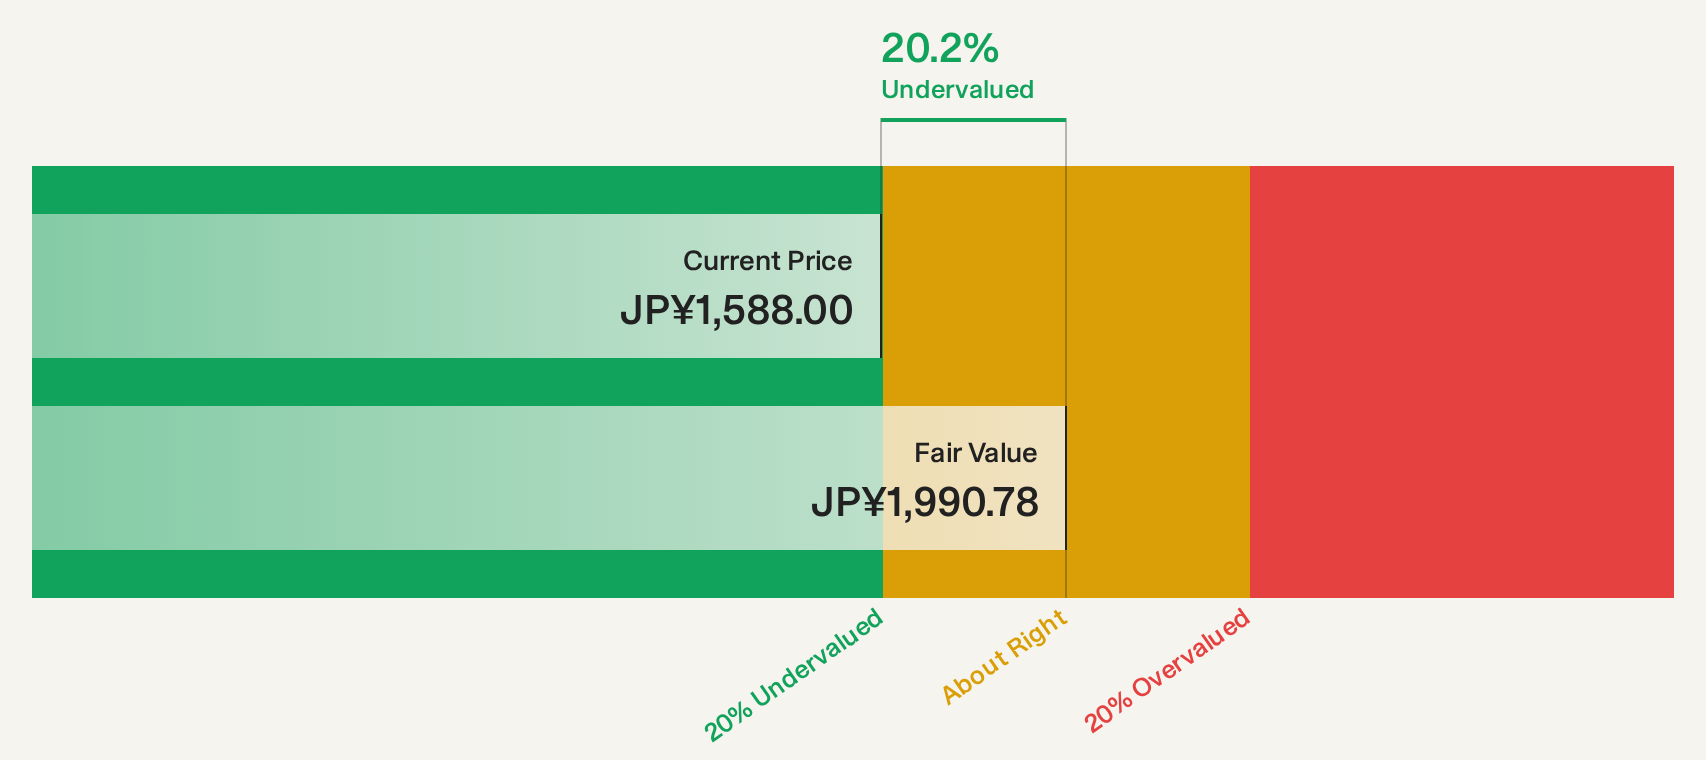
Estimated Discount To Fair Value: 25.2%
Sankyu is trading at ¥1,586.5, well below its estimated future cash flow value of ¥2,121.01, suggesting undervaluation based on cash flows. Despite slower revenue and earnings growth forecasts compared to the Japanese market, Sankyu's recent strategic alliance with TVS Supply Chain Solutions could unlock new growth avenues in Asia and beyond. The company also completed a share buyback for ¥25.86 million and offers a reliable dividend yield of 3.33%.
- The analysis detailed in our Sankyu growth report hints at robust future financial performance.
- Take a closer look at Sankyu's balance sheet health here in our report.
Ta Chen Stainless Pipe (TWSE:2027)
Overview: Ta Chen Stainless Pipe Co., Ltd. is engaged in the manufacturing, processing, and sale of stainless steel pipes, plates, fittings, and venetian blinds across Taiwan, the United States, China, and internationally with a market cap of NT$108.76 billion.
Operations: The company's revenue segments include NT$24.32 billion from the Screws and Nuts Segment, NT$26.59 billion from Aluminum Products Manufacturing, and NT$98.43 billion from the Stainless Steel and Aluminum Products Department.
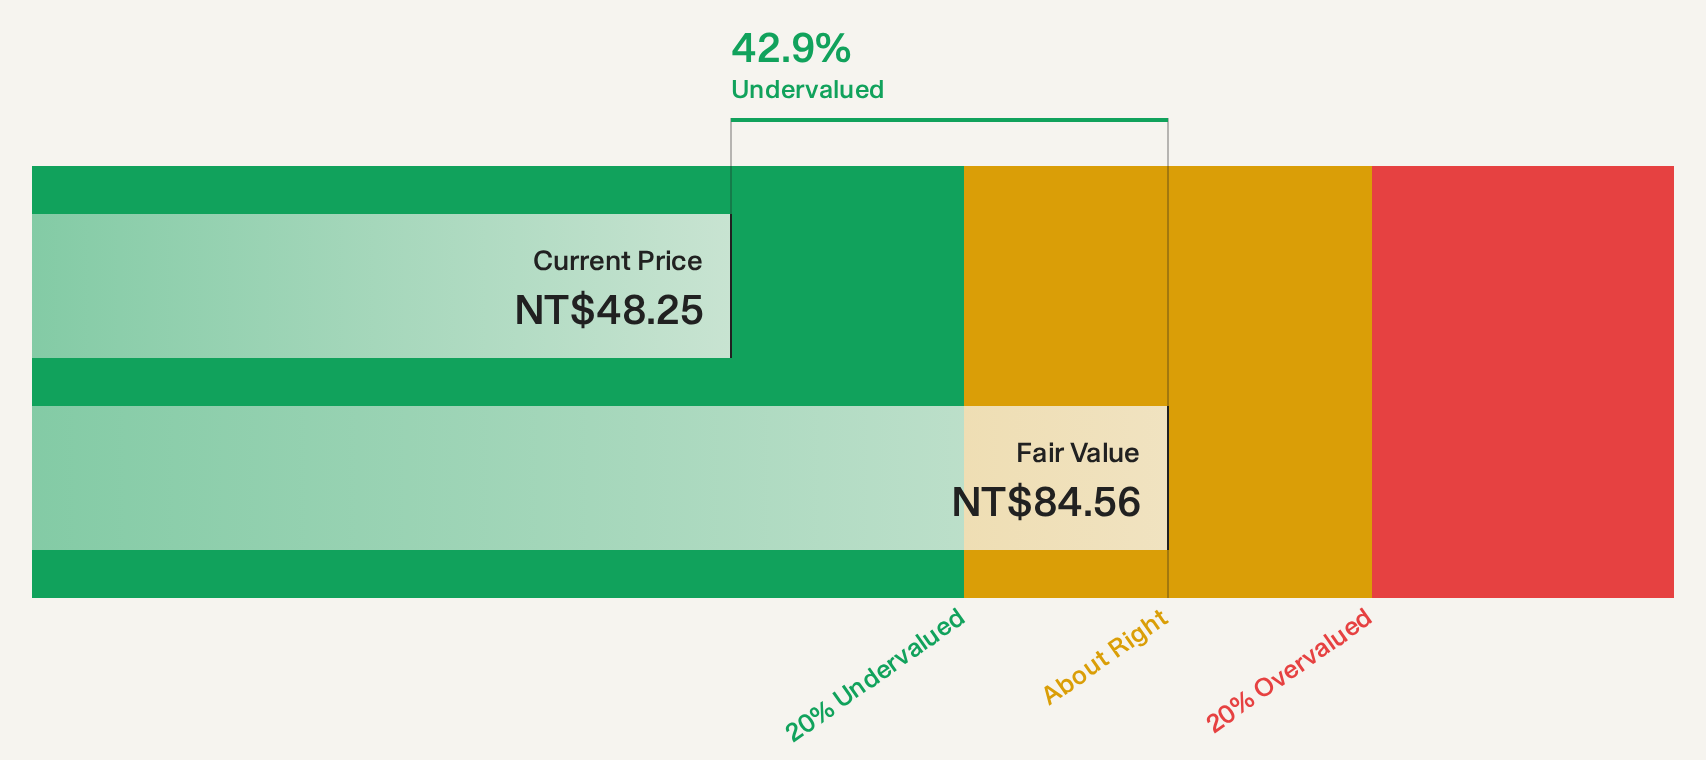
Estimated Discount To Fair Value: 43.2%
Ta Chen Stainless Pipe is trading at NT$47.7, significantly below its estimated future cash flow value of NT$83.92, highlighting potential undervaluation based on cash flows. Despite a robust earnings increase of 193% over the past year and favorable valuation compared to peers, revenue growth is projected to lag the Taiwan market, and earnings are expected to decline by an average of 1.6% annually over the next three years.
- The growth report we've compiled suggests that Ta Chen Stainless Pipe's future prospects could be on the up.
- Click to explore a detailed breakdown of our findings in Ta Chen Stainless Pipe's balance sheet health report.
Taking Advantage
- Investigate our full lineup of 160 Undervalued Asian Stocks Based On Cash Flows right here.
- Already own these companies? Bring clarity to your investment decisions by linking up your portfolio with Simply Wall St, where you can monitor all the vital signs of your stocks effortlessly.
- Join a community of smart investors by using Simply Wall St. It's free and delivers expert-level analysis on worldwide markets.
Seeking Other Investments?
- Explore high-performing small cap companies that haven't yet garnered significant analyst attention.
- Diversify your portfolio with solid dividend payers offering reliable income streams to weather potential market turbulence.
- Fuel your portfolio with companies showing strong growth potential, backed by optimistic outlooks both from analysts and management.
This article by Simply Wall St is general in nature. We provide commentary based on historical data and analyst forecasts only using an unbiased methodology and our articles are not intended to be financial advice. It does not constitute a recommendation to buy or sell any stock, and does not take account of your objectives, or your financial situation. We aim to bring you long-term focused analysis driven by fundamental data. Note that our analysis may not factor in the latest price-sensitive company announcements or qualitative material. Simply Wall St has no position in any stocks mentioned.
Have feedback on this article? Concerned about the content? Get in touch with us directly. Alternatively, email editorial-team@simplywallst.com