


European markets have recently experienced volatility, with factors like rising oil prices and sovereign bond yields affecting investor sentiment. Despite these challenges, opportunities remain for investors willing to explore smaller or newer companies. Penny stocks, while an older term, still represent a valuable investment area when they are backed by strong financials and fundamentals. In this article, we explore three European penny stocks that exhibit promising fundamentals and the potential for growth.
Let's review some notable picks from our screened stocks.
FAE Technology (BIT:FAE)
Simply Wall St Financial Health Rating: ★★★★☆☆
Overview: FAE Technology S.p.A. specializes in the design, development, and manufacturing of embedded and custom electronic products in Italy, with a market cap of €86.18 million.
Operations: FAE Technology S.p.A. has not reported specific revenue segments.
Market Cap: €86.18M
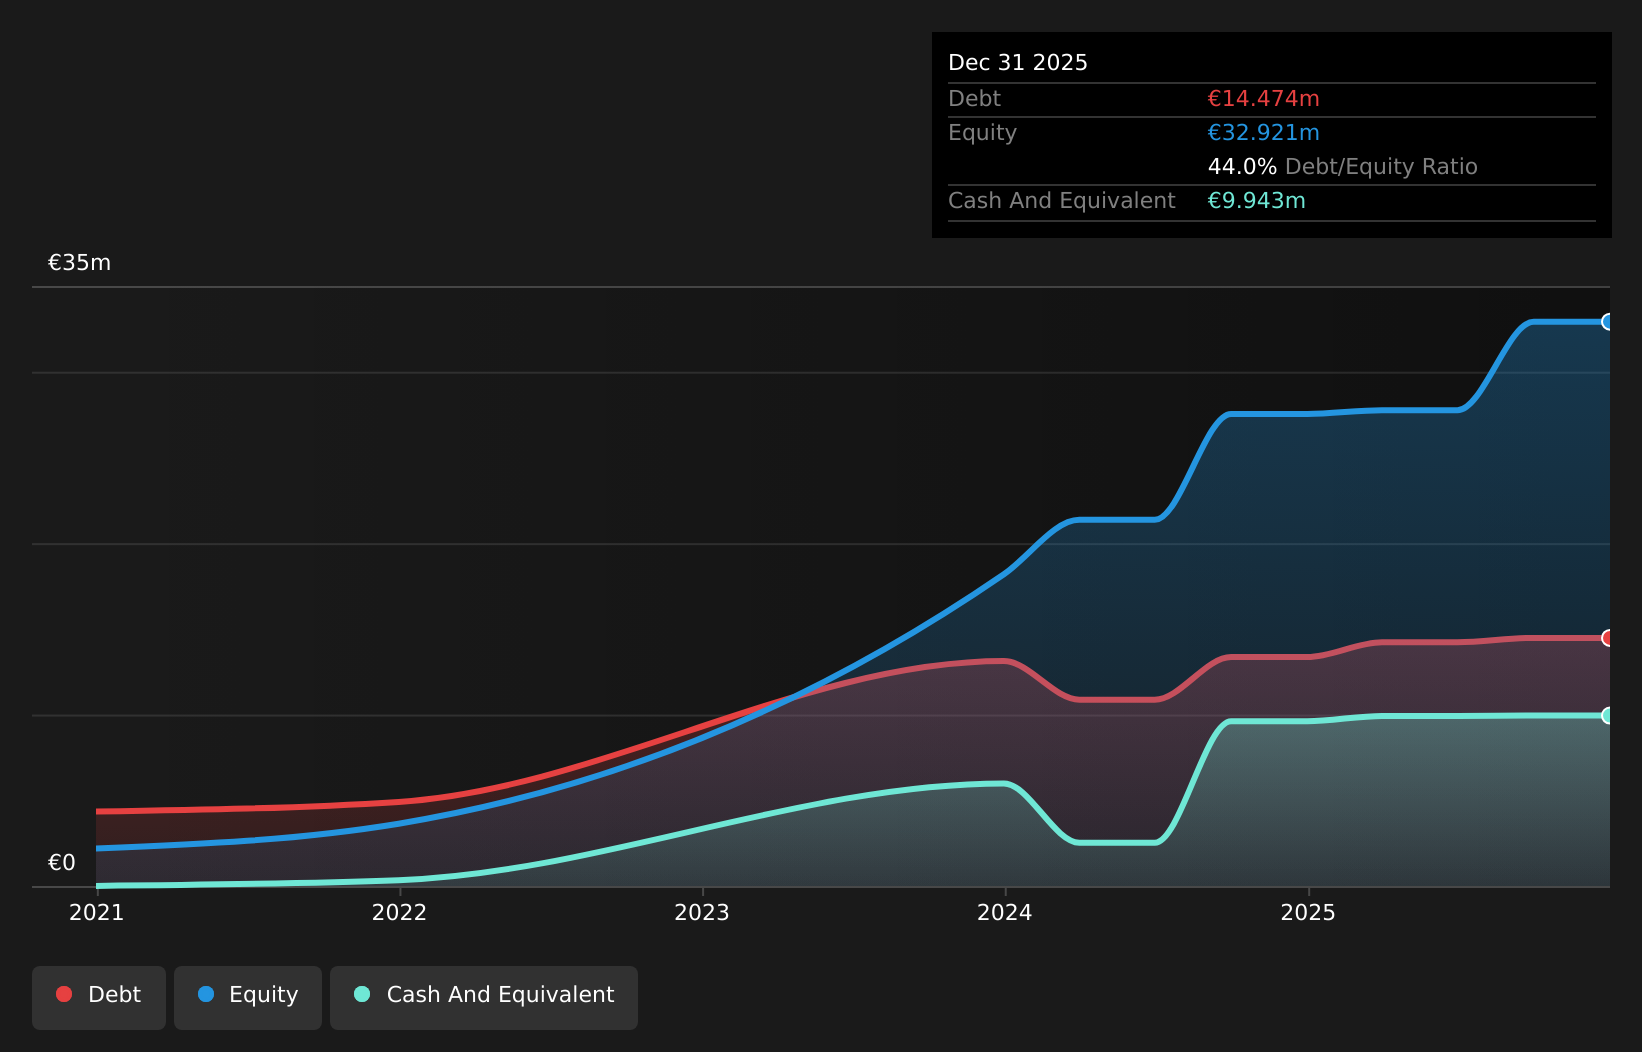
FAE Technology S.p.A., with a market cap of €86.18 million, has shown robust earnings growth of 162.3% over the past year, outpacing the electronic industry average. Recent half-year results reported revenue of €42.3 million and net income of €0.60 million, reflecting improved profit margins from 1.2% to 2.6%. Despite high non-cash earnings and stable weekly volatility at 3%, challenges remain with a high net debt to equity ratio (43%) and negative operating cash flow impacting debt coverage. Short-term assets (€59.9M) exceed both short-term (€34.1M) and long-term liabilities (€13.5M), indicating liquidity strength amidst these concerns.
- Click to explore a detailed breakdown of our findings in FAE Technology's financial health report.
- Assess FAE Technology's future earnings estimates with our detailed growth reports.
Turbomecanica (BVB:TBM)
Simply Wall St Financial Health Rating: ★★★★★★
Overview: Turbomecanica SA manufactures and sells engines, mechanical assemblies, and equipment for aircraft and helicopters across Europe, the United States, and Asia with a market cap of RON110.09 million.
Operations: Turbomecanica SA has not reported any specific revenue segments.
Market Cap: RON110.09M
Turbomecanica SA, with a market cap of RON110.09 million, reported half-year sales of RON74.24 million and net income of RON5.47 million, showing improved profitability from the previous year despite declining revenues. The company's debt management is sound, with a reduced debt to equity ratio now at 19.1% and interest payments well covered by EBIT (3.6x). However, earnings have declined by 4.3% annually over the past five years, and profit margins have decreased to 3%. Short-term assets significantly exceed both short-term and long-term liabilities, indicating strong liquidity amidst these challenges in earnings growth stability.
- Dive into the specifics of Turbomecanica here with our thorough balance sheet health report.
- Understand Turbomecanica's track record by examining our performance history report.

Afarak Group (HLSE:AFAGR)
Simply Wall St Financial Health Rating: ★★★★★★
Overview: Afarak Group SE extracts, processes, markets, and trades specialized metals across Finland, other EU countries, the United States, China, Africa, and internationally with a market cap of €60.91 million.
Operations: The company's revenue is primarily generated from its Speciality Alloys segment at €111.93 million and its Ferro Alloys segment at €9.23 million.
Market Cap: €60.91M
Afarak Group SE, with a market cap of €60.91 million, has seen its debt to equity ratio significantly decrease from 170.6% to 4.6% over five years, reflecting improved financial health. Despite this progress, the company remains unprofitable with increasing losses at an annual rate of 39.6%. However, Afarak holds more cash than total debt and maintains a stable cash runway exceeding three years due to positive free cash flow management. Recent earnings for the half-year ended June 2026 showed sales of €57.12 million but resulted in a net loss of €0.473 million compared to last year's profit.
- Unlock comprehensive insights into our analysis of Afarak Group stock in this financial health report.
- Assess Afarak Group's previous results with our detailed historical performance reports.

Where To Now?
- Click this link to deep-dive into the 264 companies within our European Penny Stocks screener.
- Ready To Venture Into Other Investment Styles? We've found 8 US stocks that are forecast to pay a dividend yeild of over 6% next year. See the full list for free.
This article by Simply Wall St is general in nature. We provide commentary based on historical data and analyst forecasts only using an unbiased methodology and our articles are not intended to be financial advice. It does not constitute a recommendation to buy or sell any stock, and does not take account of your objectives, or your financial situation. We aim to bring you long-term focused analysis driven by fundamental data. Note that our analysis may not factor in the latest price-sensitive company announcements or qualitative material. Simply Wall St has no position in any stocks mentioned.
Have feedback on this article? Concerned about the content? Get in touch with us directly. Alternatively, email editorial-team@simplywallst.com