


VSE (VSEC) reported record Q2 2026 revenue and profitability, tied to completed acquisitions of PAG and Northstar and an adjusted EBITDA margin of 19.2%. Management also raised full-year 2026 guidance.
VSE shares trade at US$168.48 after a sharp 30 day share price decline of 17.38% and a 90 day slide of 18.42%. Total shareholder return is still up 3.81% over one year and has multiplied roughly 3x over five years, which suggests strong long run momentum, even as the latest Q2 record results and guidance raise have not yet reversed the recent pullback.
Scan how VSE compares with other aviation exposed opportunities by running your own checks against our hand picked list of list of solid balance sheet and fundamentals (25 results).
VSE has just logged record results while the share price has reset. So where does fair value actually line up between a US$168 quote and materially higher analyst and intrinsic estimates?
Price-to-Earnings of 63.5x: Is it justified?
On simple valuation math, VSE trades on a P/E of 63.5x, which is high relative to many industrial stocks and comes after a share price pullback to $168.48.
The P/E ratio compares what investors are paying today for each dollar of current earnings. For an aviation aftermarket specialist like VSE, a richer multiple can reflect expectations that profit growth, cash generation, or competitive position will justify paying more for each dollar of earnings.
Here the signal is mixed. VSE is described as expensive versus the broader US Aerospace & Defense industry average P/E of 35.4x. The current multiple is also well above an estimated fair P/E of 34.5x, which suggests the market price could eventually move closer to that lower level if sentiment normalizes.
Explore the SWS fair ratio for VSE.
Result: Price-to-Earnings of 63.5x (OVERVALUED)
Still, the recent 17% to 18% share price slide and a rich 63.5x P/E leave VSE exposed if aviation demand softens or if the integration of PAG and Northstar disappoints.
Find out about the key risks to this VSE narrative.
Another view on VSE’s value
The P/E picture paints VSE as expensive. A different lens tells a very different story. The SWS DCF model puts future cash flow value at about $290.74 per share, while the current price is $168.48. That points to the stock trading at a steep discount. Which signal should carry more weight in your process?
Look into how the SWS DCF model arrives at its fair value.
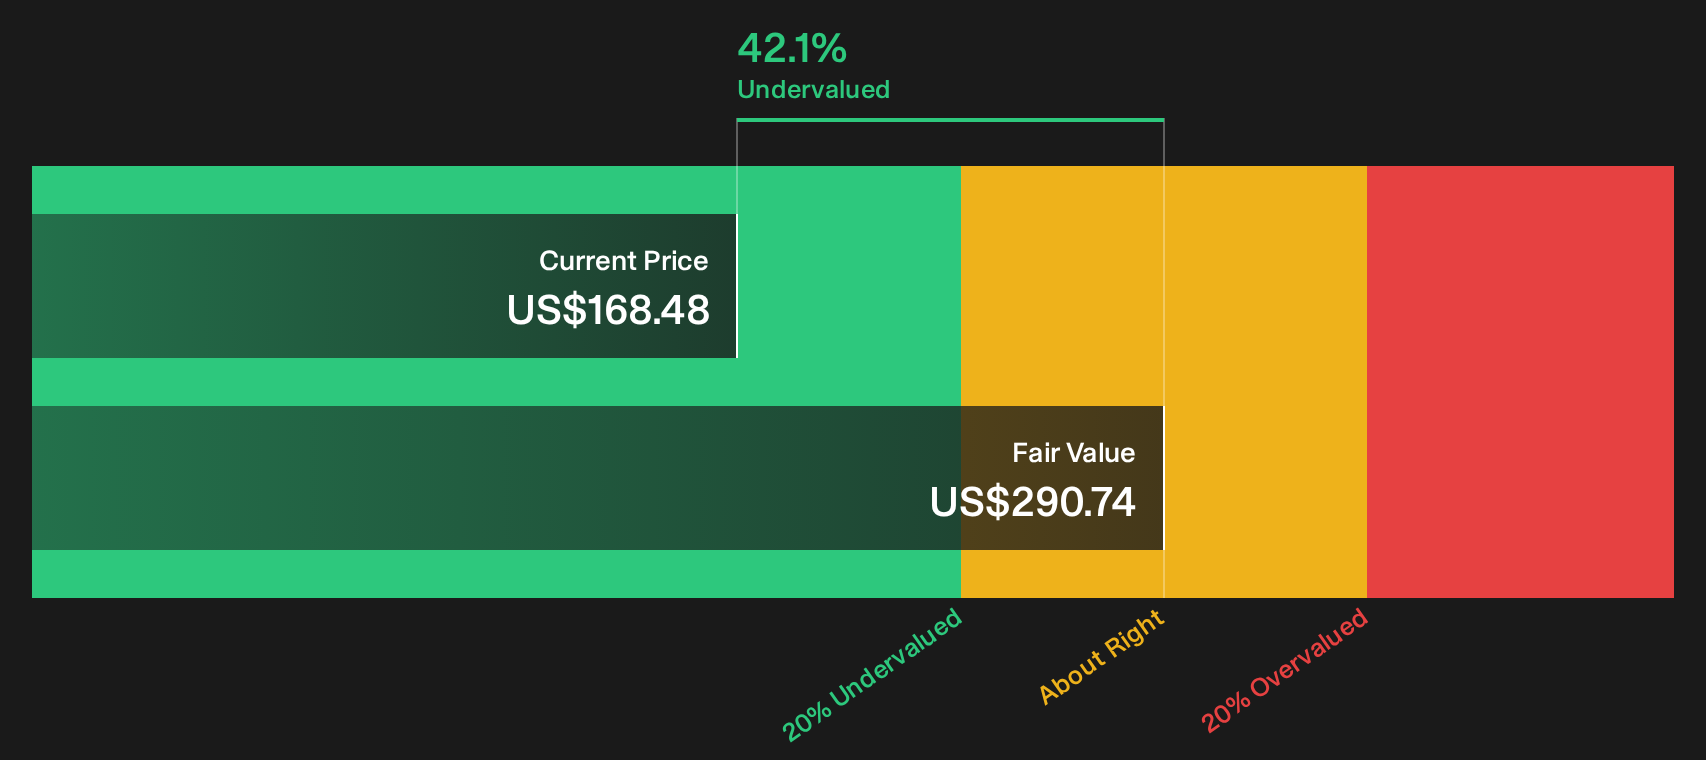
Simply Wall St performs a discounted cash flow (DCF) on every stock in the world every day (check out VSE for example). We show the entire calculation in full. You can track the result in your watchlist or portfolio and be alerted when this changes, or use our stock screener to discover 27 high quality undervalued stocks. If you save a screener we even alert you when new companies match - so you never miss a potential opportunity.
Next Steps
Mixed signals on VSE so far. If you want to act while sentiment is still split, it helps to see both sides clearly with 4 key rewards and 1 important warning sign
Looking for more VSE-style investment ideas?
Do not stop with VSE. Fresh ideas often come from scanning outside your usual watchlist, and missing that next filter could mean missing a future winner entirely.
- Target potential mispricing by checking which companies screen as high quality yet unloved using the 27 high quality undervalued stocks.
- Strengthen your income shortlist by focusing on businesses with resilient payouts through the 8 dividend fortresses.
- Reduce portfolio stress by filtering for sturdier balance sheets and cleaner fundamentals via the 31 resilient stocks with low risk scores.
This article by Simply Wall St is general in nature. We provide commentary based on historical data and analyst forecasts only using an unbiased methodology and our articles are not intended to be financial advice. It does not constitute a recommendation to buy or sell any stock, and does not take account of your objectives, or your financial situation. We aim to bring you long-term focused analysis driven by fundamental data. Note that our analysis may not factor in the latest price-sensitive company announcements or qualitative material. Simply Wall St has no position in any stocks mentioned.
Have feedback on this article? Concerned about the content? Get in touch with us directly. Alternatively, email editorial-team@simplywallst.com