


In a global market characterized by mixed performances across major indices and persistent inflation concerns, investors are navigating an environment of elevated Treasury yields and geopolitical uncertainties. Amidst these challenges, identifying undervalued stocks can offer opportunities for those looking to capitalize on potential discrepancies between a company's intrinsic value and its current market price.
Top 10 Undervalued Stocks Based On Cash Flows
| Name | Current Price | Fair Value (Est) | Discount (Est) |
| TOKAI (TSE:9729) | ¥2553.00 | ¥5037.09 | 49.3% |
| Promotica (BIT:PMT) | €2.98 | €5.91 | 49.6% |
| PORR (WBAG:POS) | €30.65 | €60.31 | 49.2% |
| PAL GROUP Holdings (TSE:2726) | ¥1439.00 | ¥2864.20 | 49.8% |
| Orthex Oyj (HLSE:ORTHEX) | €4.50 | €8.90 | 49.4% |
| Hainan Jinpan Smart Technology (SHSE:688676) | CN¥61.53 | CN¥123.23 | 50.1% |
| ENN Energy Holdings (SEHK:2688) | HK$48.96 | HK$96.85 | 49.4% |
| BuySell TechnologiesLtd (TSE:7685) | ¥2776.00 | ¥5536.27 | 49.9% |
| APAC Realty (SGX:CLN) | SGD0.52 | SGD1.03 | 49.7% |
| AK Medical Holdings (SEHK:1789) | HK$4.75 | HK$9.49 | 49.9% |
Let's dive into some prime choices out of the screener.
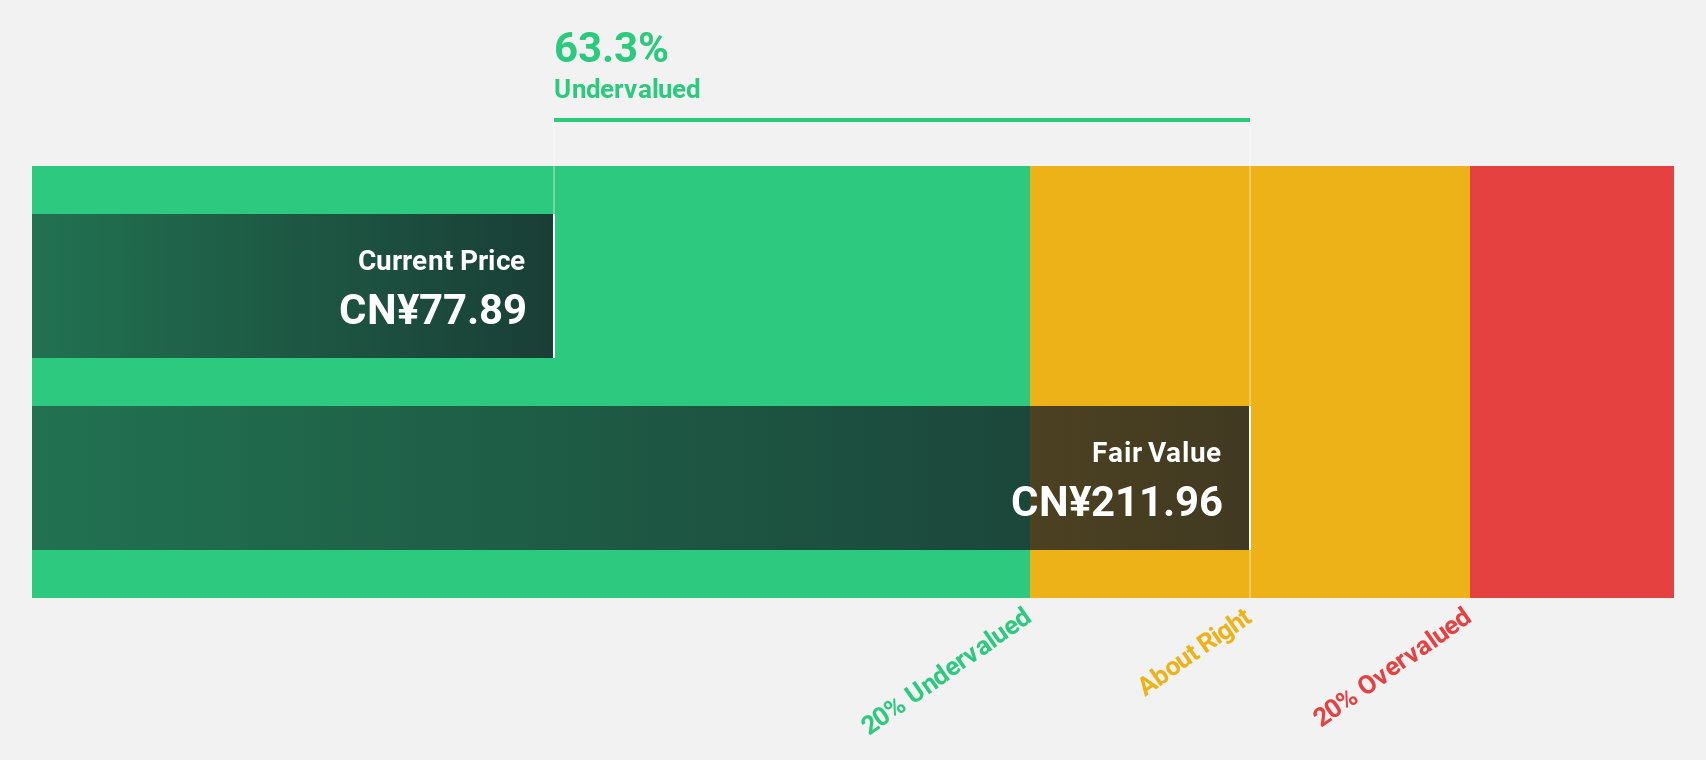
YanKer shop FoodLtd (SZSE:002847)
Overview: YanKer shop Food Co., Ltd engages in the research, development, production, and sale of leisure food products both in China and internationally, with a market capitalization of CN¥11.73 billion.
Operations: The company's revenue from the Food Manufacturing Industry segment is CN¥5.89 billion.
Estimated Discount To Fair Value: 32.5%
YanKer shop Food Ltd. is trading at a significant discount to its estimated future cash flow value, with shares priced at CNY 43.41 compared to a projected value of CNY 64.34. Despite slower revenue and earnings growth forecasts than the broader Chinese market, the company has shown profit growth of 15.5% over the past year and maintains strong relative value against peers. Recent changes in corporate governance and capital structure might influence future financial strategies.
- The analysis detailed in our YanKer shop FoodLtd growth report hints at robust future financial performance.
- Delve into the full analysis health report here for a deeper understanding of YanKer shop FoodLtd.
Riken Technos (TSE:4220)
Overview: Riken Technos Corporation operates in the compound, film, and food packaging sectors across Japan, Thailand, the United States, China, Europe, and other international markets with a market cap of ¥113.43 billion.
Operations: Riken Technos generates revenue from various segments, including Electronics at ¥26.49 billion, Transportation at ¥43.49 billion, Daily Life & Healthcare at ¥37.10 billion, and Building & Construction at ¥26.74 billion.
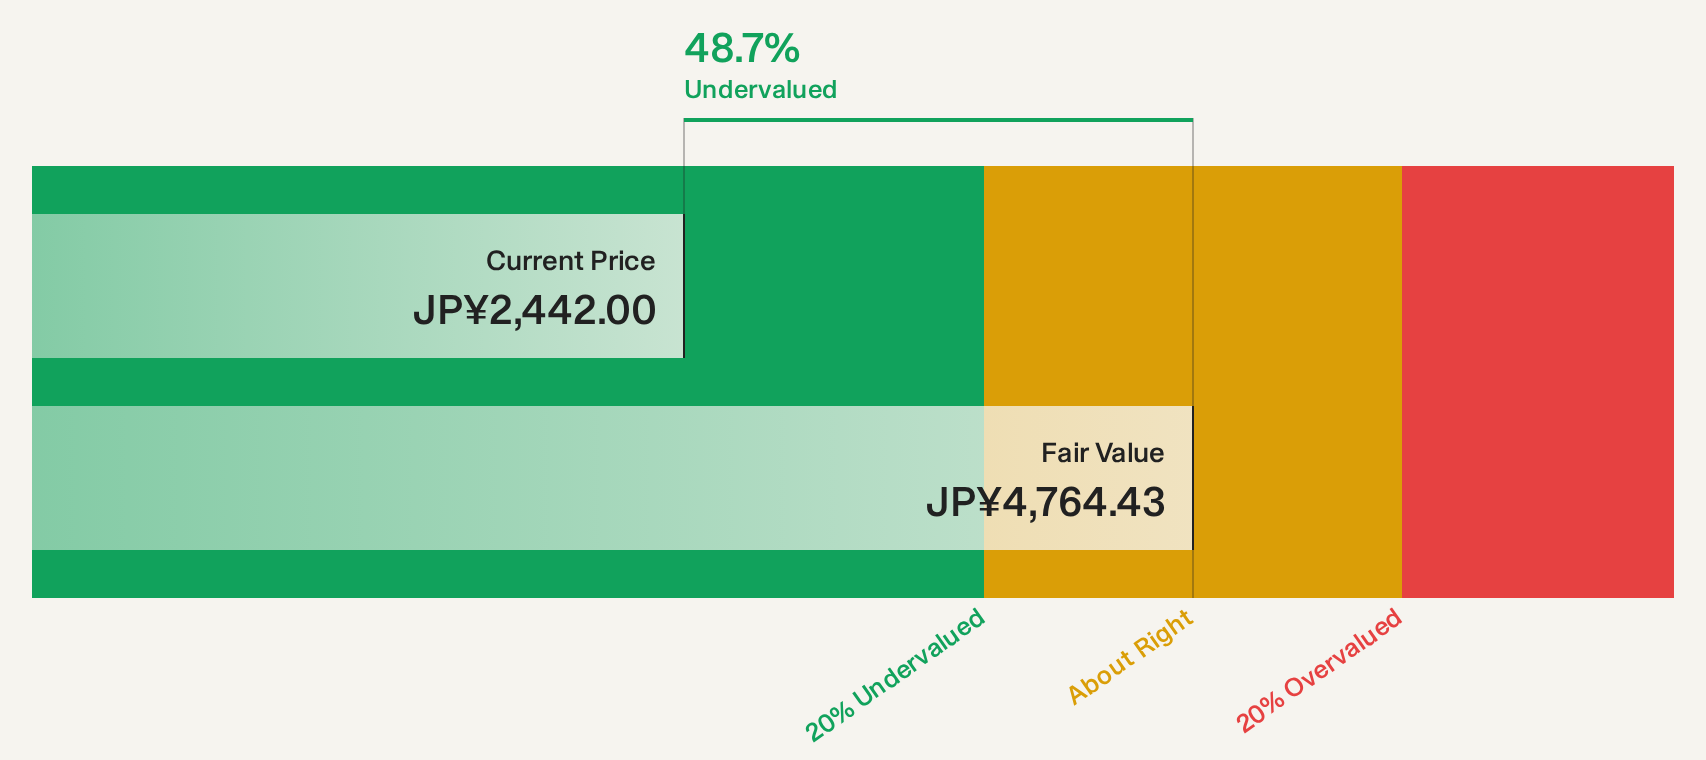
Estimated Discount To Fair Value: 49.1%
Riken Technos trades at a significant discount to its estimated future cash flow value, with shares priced at ¥2,445 versus a projected ¥4,803.68. Despite earnings growth forecasts of 6.7% annually, slower than the Japanese market average of 9.5%, recent profit growth reached 28.1%. The company completed a share buyback and revised financial guidance upwards due to increased domestic sales and strategic asset management initiatives enhancing capital efficiency and shareholder returns.
- Our growth report here indicates Riken Technos may be poised for an improving outlook.
- Click here to discover the nuances of Riken Technos with our detailed financial health report.
H2O Retailing (TSE:8242)
Overview: H2O Retailing Corporation operates a diverse range of retail-related businesses, such as department stores, supermarkets, shopping centers, specialty stores, and convenience stores in Japan, with a market cap of ¥313.14 billion.
Operations: The company's revenue is derived from department stores (¥395,058 million), supermarkets (¥476,551 million), shopping centers (¥15,902 million), specialty stores (¥24,890 million), and convenience stores (¥5,683 million) in Japan.
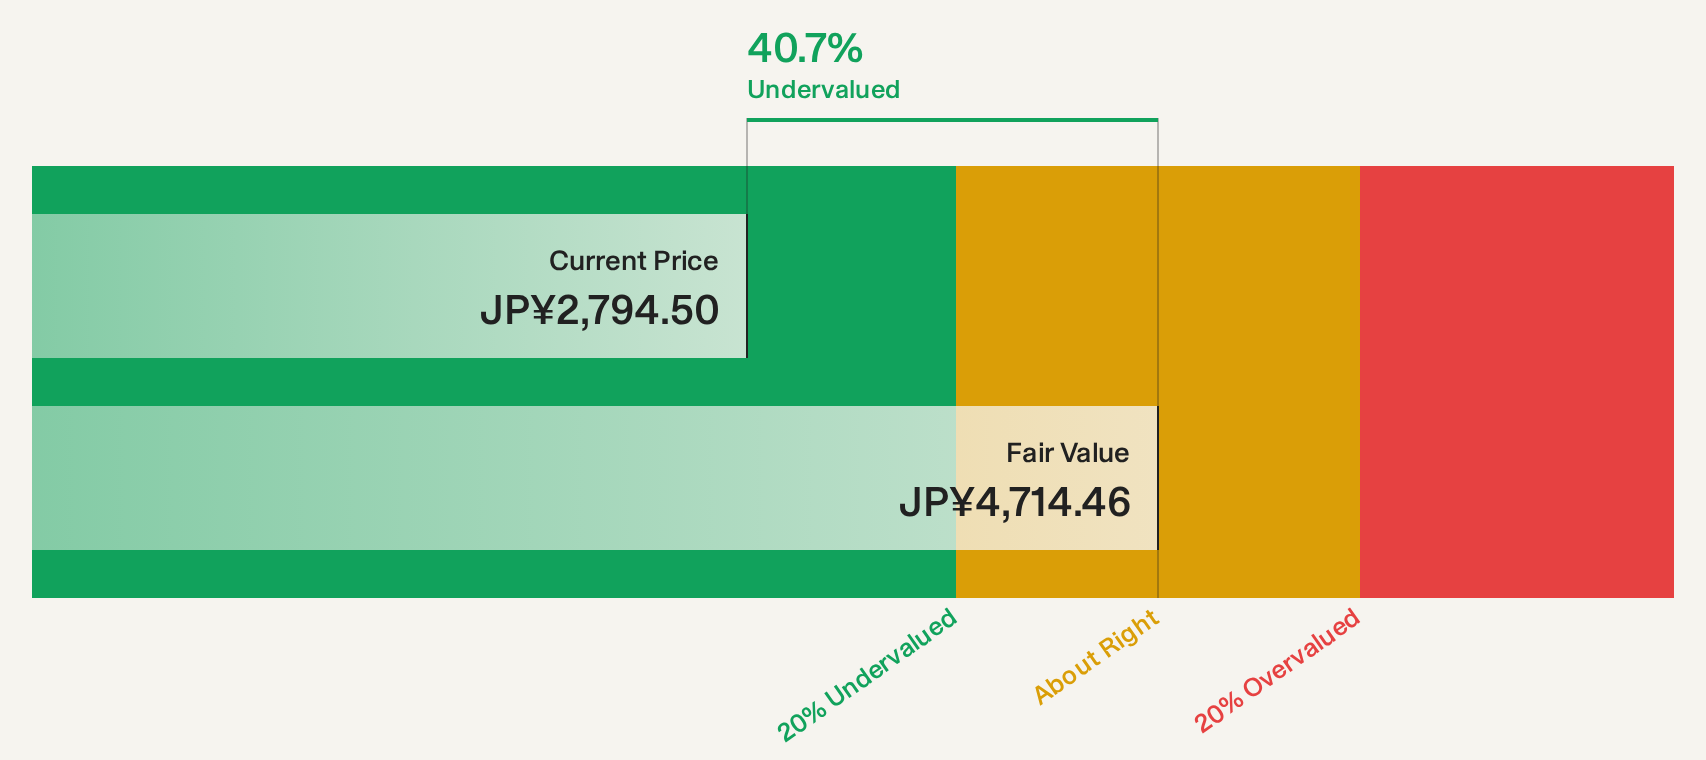
Estimated Discount To Fair Value: 40.2%
H2O Retailing is trading at ¥2,813, significantly below its estimated future cash flow value of ¥4,703.52, indicating it may be undervalued. Despite a 193.2% earnings growth over the past year and recent share buybacks totaling ¥10.11 billion, forecasts suggest a 13% annual decline in earnings for the next three years and slower revenue growth at 2.3%. The company maintains stable dividends but faces challenges with low future return on equity projections of 7.3%.
- Our comprehensive growth report raises the possibility that H2O Retailing is poised for substantial financial growth.
- Click here and access our complete balance sheet health report to understand the dynamics of H2O Retailing.
Taking Advantage
- Gain an insight into the universe of 238 Undervalued Global Stocks Based On Cash Flows by clicking here.
- Are you invested in these stocks already? Keep abreast of every twist and turn by setting up a portfolio with Simply Wall St, where we make it simple for investors like you to stay informed and proactive.
- Invest smarter with the free Simply Wall St app providing detailed insights into every stock market around the globe.
Ready To Venture Into Other Investment Styles?
- Explore high-performing small cap companies that haven't yet garnered significant analyst attention.
- Diversify your portfolio with solid dividend payers offering reliable income streams to weather potential market turbulence.
- Fuel your portfolio with companies showing strong growth potential, backed by optimistic outlooks both from analysts and management.
This article by Simply Wall St is general in nature. We provide commentary based on historical data and analyst forecasts only using an unbiased methodology and our articles are not intended to be financial advice. It does not constitute a recommendation to buy or sell any stock, and does not take account of your objectives, or your financial situation. We aim to bring you long-term focused analysis driven by fundamental data. Note that our analysis may not factor in the latest price-sensitive company announcements or qualitative material. Simply Wall St has no position in any stocks mentioned.
Have feedback on this article? Concerned about the content? Get in touch with us directly. Alternatively, email editorial-team@simplywallst.com