


St. Joe (JOE) is back in focus after the company opened custom homesite sales at The Gallery, its new gated Watersound community in Inlet Beach, Florida, through a competitive bidding process.
St. Joe’s recent move to open bidding on The Gallery comes as the share price sits at US$65.98, with a 90 day share price return of 10.78% and a 1 year total shareholder return of 41.26%. This suggests momentum has been building over the past year, even though the very short term has been relatively muted.
Scan for other real estate plays with similar momentum by reviewing the handpicked 27 high quality undervalued stocks.
St. Joe now trades with an estimated 58% gap to one valuation model, even as The Gallery launch points to active buyer interest. Is the market sensibly cautious, or overly discounting the story here?
Preferred P/E of 30.5x: Is It Justified For St. Joe?
Valuation is where the St. Joe story gets complicated. The shares last closed at $65.98, yet the SWS DCF model points to a future cash flow value of $155.86, which implies the stock trades at a 57.7% discount to that estimate even while the P/E ratio sits at 30.5x.
P/E simply compares what investors pay today for each dollar of current earnings. For a real estate development and hospitality group with $547.84m of revenue and $123.049m of net income, this yardstick hints at how much of those profits the market is pricing into the current tag.
JOE’s P/E of 30.5x is described as expensive versus both the broader US Real Estate industry on 15x and a narrower peer set on 25.7x. That gap suggests investors are accepting a richer multiple relative to similar businesses, while the same dataset also flags St. Joe as trading materially below one DCF based fair value estimate, which creates a sharp contrast between earnings based and cash flow based views.
The industry comparison is blunt. At more than double the US Real Estate average multiple and above the peer group level, the 30.5x figure signals that the market is assigning a premium price tag to JOE’s current earnings stream compared to sector norms.
See what the numbers say about this price — find out in our valuation breakdown.
Result: Price-to-earnings of 30.5x (OVERVALUED).
Still, St. Joe’s premium P/E and reliance on real estate activity leave the story exposed if buyer appetite cools or if project timelines face setbacks.
Find out about the key risks to this St. Joe narrative.
Another View On St. Joe’s Value
There is a sharp contrast here. While St. Joe looks expensive on a 30.5x P/E against real estate peers, the SWS DCF model suggests the shares trade at a 57.7% discount to an estimated future cash flow value of $155.86. Which signal should carry more weight for you?
For a closer look at how that cash flow estimate is built and what assumptions sit underneath it, review the Look into how the SWS DCF model arrives at its fair value.
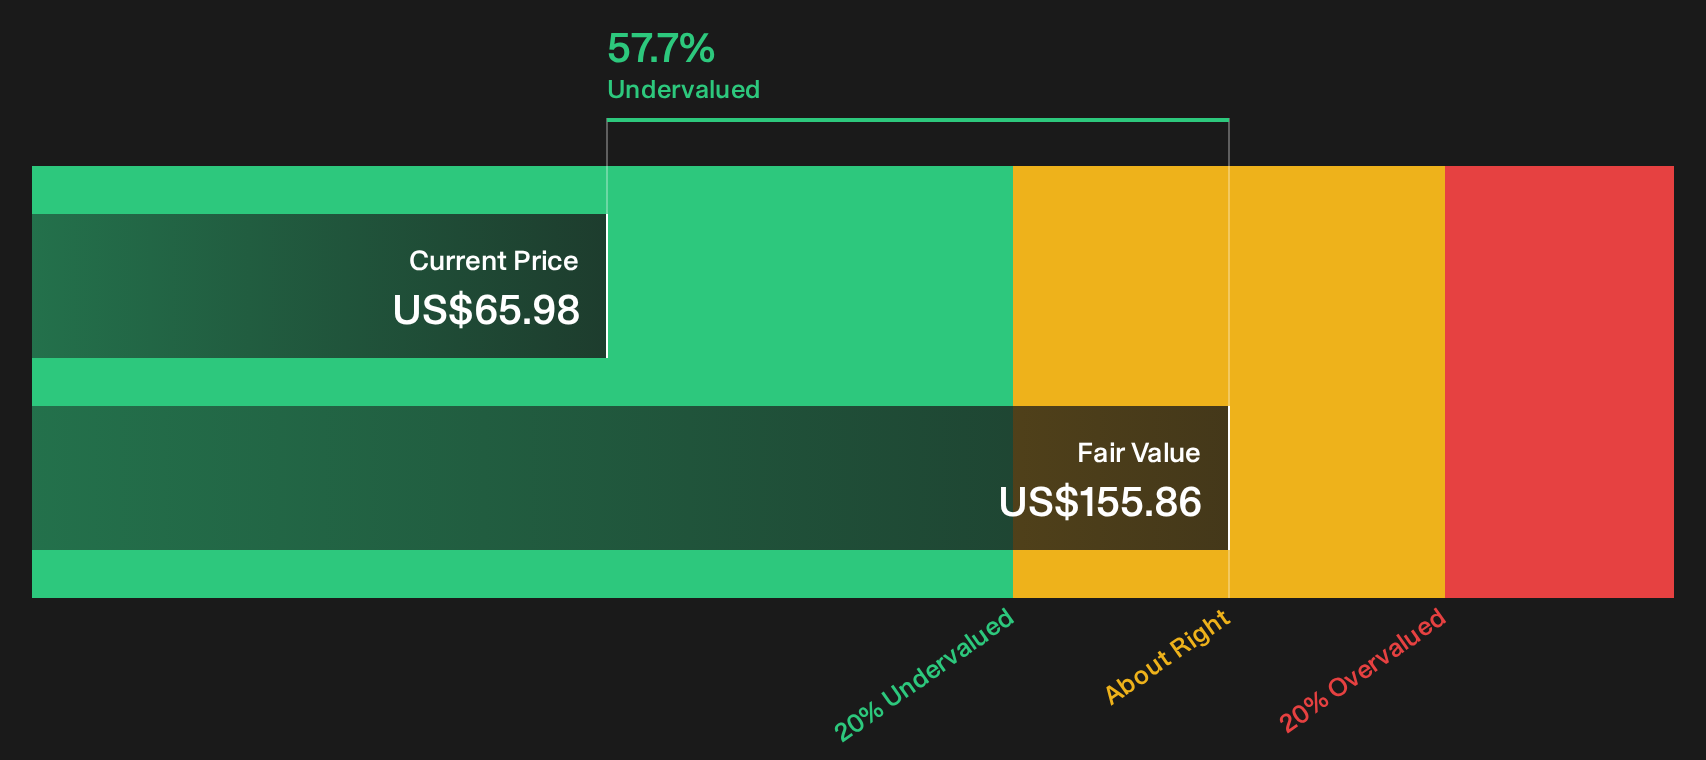
Simply Wall St performs a discounted cash flow (DCF) on every stock in the world every day (check out St. Joe for example). We show the entire calculation in full. You can track the result in your watchlist or portfolio and be alerted when this changes, or use our stock screener to discover 27 high quality undervalued stocks. If you save a screener we even alert you when new companies match - so you never miss a potential opportunity.
Next Steps
Mixed signals around St. Joe’s valuation and momentum can feel hard to pin down, so move quickly, stress test the numbers yourself, and weigh both the upside drivers and pressure points flagged in the 2 key rewards and 1 important warning sign
Looking for more investment ideas beyond St. Joe?
If St. Joe has your attention, do not stop there. Use this momentum to broaden your watchlist and pressure test your thesis against fresh opportunities.
- Target reliable cash generators by reviewing the 8 dividend fortresses that pair income potential with established payout records.
- Hunt for mispriced opportunities through the 27 high quality undervalued stocks that blend strong fundamentals with potentially attractive entry points.
- Prioritize financial resilience by scanning the list of solid balance sheet and fundamentals (25 results) that highlight businesses with sturdier capital structures and cleaner balance sheets.
This article by Simply Wall St is general in nature. We provide commentary based on historical data and analyst forecasts only using an unbiased methodology and our articles are not intended to be financial advice. It does not constitute a recommendation to buy or sell any stock, and does not take account of your objectives, or your financial situation. We aim to bring you long-term focused analysis driven by fundamental data. Note that our analysis may not factor in the latest price-sensitive company announcements or qualitative material. Simply Wall St has no position in any stocks mentioned.
Have feedback on this article? Concerned about the content? Get in touch with us directly. Alternatively, email editorial-team@simplywallst.com