


Block (XYZ) drew fresh attention after Square was chosen by Seattle’s Pike Place Fish Market as its unified commerce platform, giving investors a live case study in complex, high-traffic merchant adoption.
Recent headlines around Pike Place Fish Market and other merchant wins have landed as Block’s 7 day share price return of 3.36% reversed part of a 30 day share price decline of 7.52%. The 1 year total shareholder return decline of 3.14% contrasts with a 3 year total shareholder return gain of 66.39%, pointing to longer term holders still sitting on sizeable gains even as shorter term momentum has cooled.
Scan how Block compares with other payment and commerce platforms by reviewing our curated list of list of solid balance sheet and fundamentals (25 results).Block’s rebound over the past week meets a longer stretch of choppy returns, which leaves a practical fork in the road for investors: lean into today’s reset, or wait for a deeper markdown before running the numbers on value.
Most Popular Narrative: 22% Undervalued
Block closed at $76.54 while the most followed valuation storyline anchors closer to $98.36. The Pike Place news therefore sits against a backdrop where the shares trade at a sizeable gap to that fair value estimate based on a 7.54% discount rate.
The rapid acceleration in new product launches, now supported by an AI native operating model that has lifted code changes per engineer 150% since early 2026 and helped ship 130 Square features in the first half of 2026, points to sustained improvements in Cash App and Square feature velocity that can support higher revenue and operating leverage over time.
See why 190 investors see Block as 22% undervalued.
Result: Fair Value of $98.36 (UNDERVALUED)
Still, the Block story can unravel if Cash App engagement plateaus around low single digit active growth, or if fresh regulatory actions push compliance costs sharply higher.
Find out about the key risks to this Block narrative.
Another View On Block’s Valuation
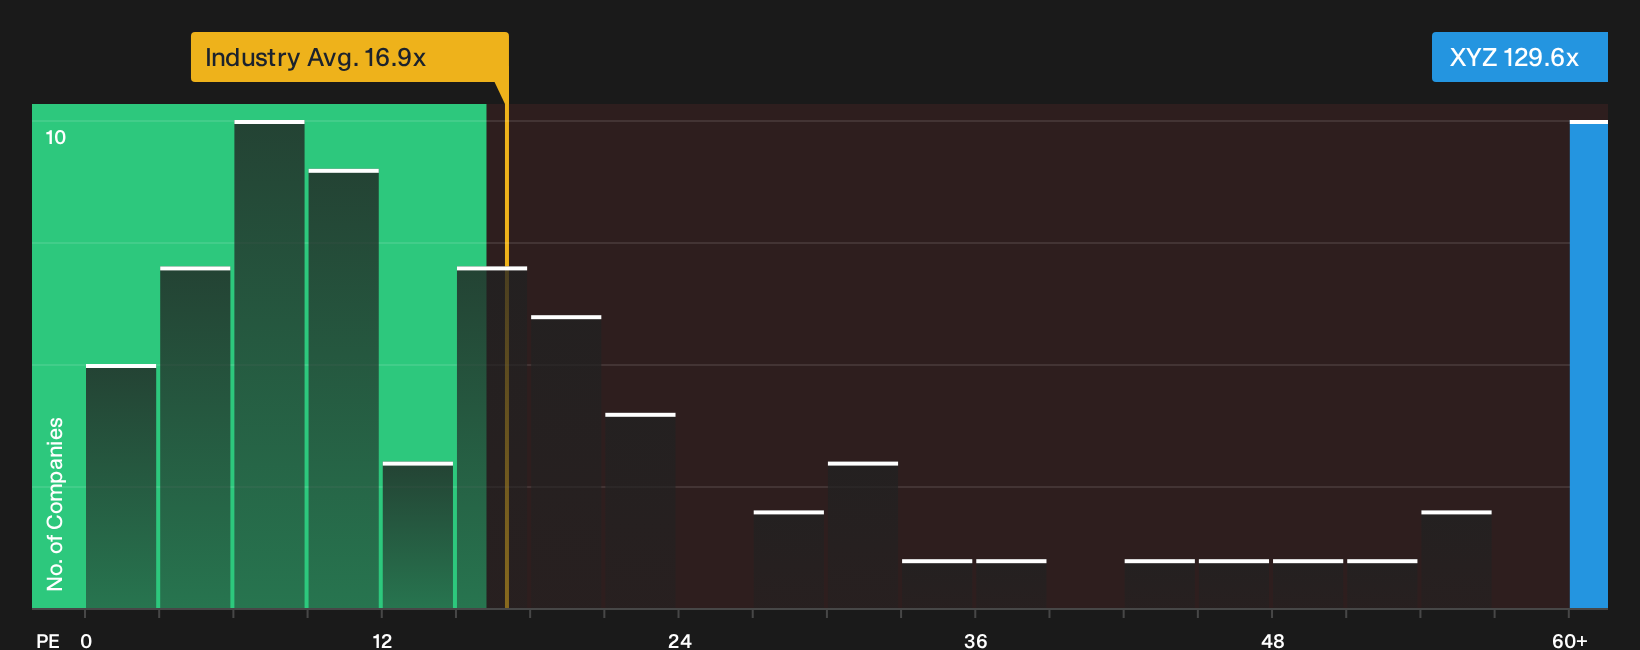
The first story around Block leans heavily on future cash flows and analyst targets that frame the stock as undervalued. A simple earnings multiple paints a very different picture. The shares trade on a P/E of 129.6x, while the fair ratio is 30.1x and the peer group averages 21.4x, so investors face the risk that sentiment cools faster than earnings can catch up. Which lens feels more realistic for you when you think about your own time horizon and risk tolerance?
To stress test that earnings based view against a more cash flow focused lens, it can help to walk through the SWS DCF model step by step. See what the numbers say about this price — find out in our valuation breakdown.
Next Steps
Mixed signals around Block’s valuation and recent headlines create plenty to debate, so move quickly to review the evidence and weigh both the upside and the downside with the help of 3 key rewards and 3 important warning signs
Looking for more investment ideas beyond Block?
If Block has you thinking harder about opportunity and risk, do not stop there. Cast a wider net now or you might miss your next best idea.
- Target resilience by scanning a curated 31 resilient stocks with low risk scores that prioritizes balance sheet strength and muted risk scores so big surprises are less likely.
- Hunt for mispriced quality using the 19 high quality undiscovered gems and see which under-followed businesses still pair strong fundamentals with room to be re-rated.
- Zero in on financial durability through the list of solid balance sheet and fundamentals (25 results) to spot companies that can better withstand shocks and still fund long term plans.
This article by Simply Wall St is general in nature. We provide commentary based on historical data and analyst forecasts only using an unbiased methodology and our articles are not intended to be financial advice. It does not constitute a recommendation to buy or sell any stock, and does not take account of your objectives, or your financial situation. We aim to bring you long-term focused analysis driven by fundamental data. Note that our analysis may not factor in the latest price-sensitive company announcements or qualitative material. Simply Wall St has no position in any stocks mentioned.
Have feedback on this article? Concerned about the content? Get in touch with us directly. Alternatively, email editorial-team@simplywallst.com