


Investors are watching Chubb (CB) ahead of its October 20, 2026 earnings release, with forecasts pointing to higher revenue but lower earnings per share, while a new UK employee-benefits platform broadens its digital distribution footprint.
At a share price of US$334.21, Chubb has delivered a 7.79% year to date share price return. The 1 year total shareholder return of 16.97% and 5 year total shareholder return of 97.86% point to momentum that has built over time rather than faded recently.
Spot similar insurers and financials that could be setting up for the next leg higher by scanning our curated list of 31 resilient stocks with low risk scores.Chubb trades about 10% below the average analyst target and at a far steeper modeled intrinsic discount, even after a strong multiyear run. Is that genuine mispricing, or is the market pricing in risk correctly?
Most Popular Narrative: 9% Undervalued
Against Chubb's last close at $334.21, the most followed narrative pegs fair value closer to $365.91. This frames the current discount as meaningful rather than marginal and anchors the debate around whether that gap reflects risk or opportunity.
The numbers imply that at the current share price, investors are paying for a company that already delivers 18.2% core operating EPS growth, a 17.1% rise in tangible book value per share, and ongoing buybacks under a US$7.5b repurchase program. Together, these factors support the view that Chubb stock is fairly valued yet still treated as bullish in this narrative.
See why 80 investors see Chubb as 9% undervalued.
Result: Fair Value of $365.91 (UNDERVALUED)
Still, if casualty loss trends outpace pricing or the shift away from underpriced large account and E&S property shrinks premium volume, the Chubb narrative could crack.
Find out about the key risks to this Chubb narrative.
Another Angle On Chubb’s Valuation
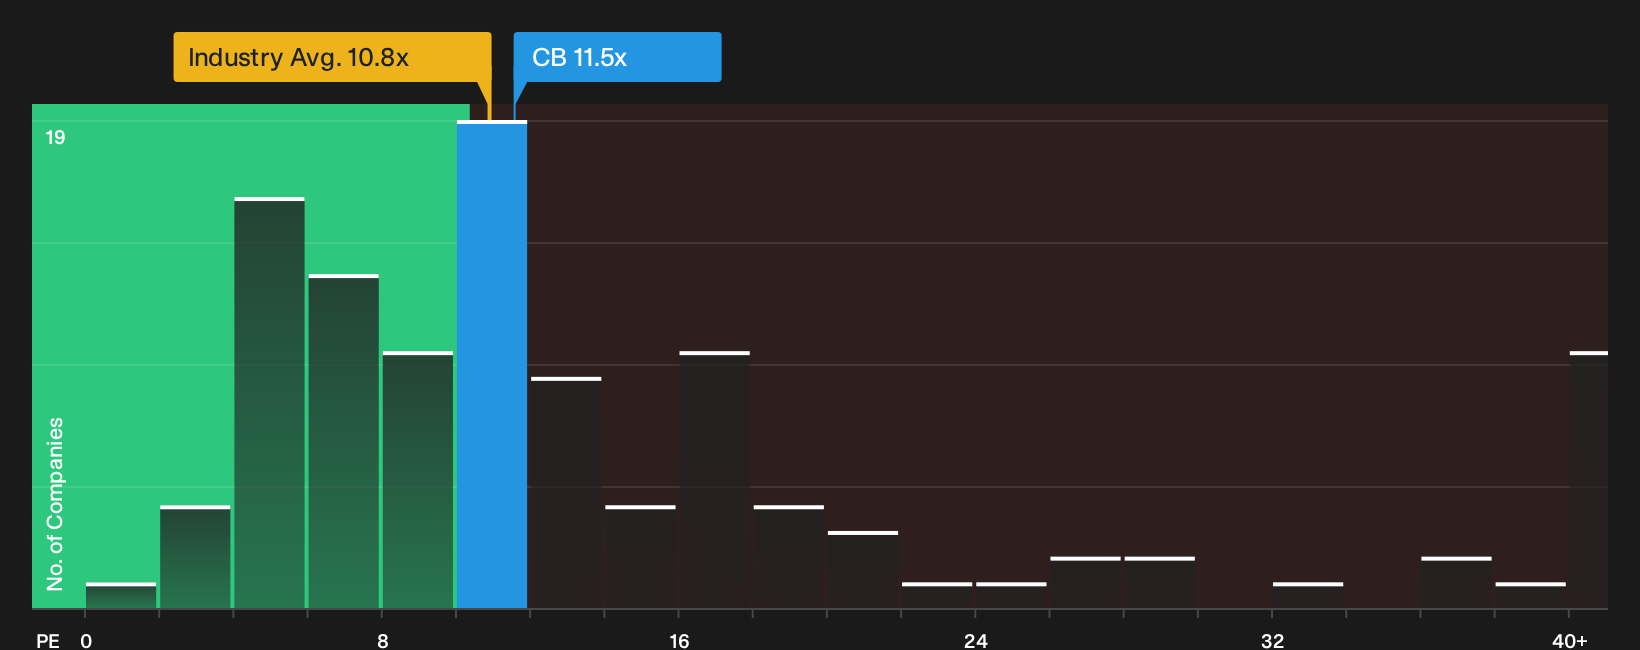
On simple earnings multiples, Chubb does not look cheap. The stock trades on an 11.5x P/E, higher than both the US Insurance sector at 10.8x and a peer average of 8.1x. It also sits above the 10.7x fair ratio that our models suggest the market could migrate toward.
That gap may reflect investors paying up for quality and consistency, or it may point to less room for error if earnings forecasts soften further. The question is whether a premium P/E on Chubb still feels comfortable once you weigh it against slower expected revenue and profit trends from here.
See what the numbers say about this price — find out in our valuation breakdown.
Next Steps
Sentiment around Chubb is mixed, with clear positives and real concerns sitting side by side, so your own judgment matters more than ever right now. Take a closer look at the 2 key rewards and 2 important warning signs.
Looking for more investment ideas beyond Chubb?
If Chubb already sits on your radar, broaden your watchlist with fresh opportunities that match different goals, income needs, and risk comfort levels.
- Target resilient balance sheets and steady fundamentals by scanning our curated list of solid balance sheet and fundamentals (25 results) so you are not relying on a single insurer for financial strength.
- Hunt for potential mispriced opportunities by running through the 19 high quality undiscovered gems and see which businesses align with the quality profile you expect from Chubb.
- Build a cash flow stream that complements Chubb by reviewing the income ideas in our 8 dividend fortresses before others move the prices away from your comfort zone.
This article by Simply Wall St is general in nature. We provide commentary based on historical data and analyst forecasts only using an unbiased methodology and our articles are not intended to be financial advice. It does not constitute a recommendation to buy or sell any stock, and does not take account of your objectives, or your financial situation. We aim to bring you long-term focused analysis driven by fundamental data. Note that our analysis may not factor in the latest price-sensitive company announcements or qualitative material. Simply Wall St has no position in any stocks mentioned.
Have feedback on this article? Concerned about the content? Get in touch with us directly. Alternatively, email editorial-team@simplywallst.com