


Healthcare Services Group (HCSG) has drawn fresh attention after recent price moves left the stock down about 3% over the past month and roughly 12% over the past 3 months.
Viewed over a longer stretch, Healthcare Services Group has a 1 year total shareholder return of 32.73% and a 3 year total shareholder return above 100%. The recent 30 day and 90 day share price weakness points to momentum fading rather than building.
Compare Healthcare Services Group’s recent swing with a curated set of quality value ideas by reviewing the 27 high quality undervalued stocks that currently clear our cash flow and balance sheet filters.
Healthcare Services Group has rewarded patient holders yet is now coming off a short streak of weakness. Does that setup still offer a favourable trade off for new buyers, or has most of the upside already been used?
Price-to-Earnings of 11.8x: Is it justified?
On simple earnings math, Healthcare Services Group changes hands at a P/E of 11.8x, while its fair P/E is estimated at 8.6x and the shares trade at $21.13.
The P/E ratio compares what you pay for each dollar of earnings. For a service provider like Healthcare Services Group, where profitability and contract stability matter more than heavy assets, this measure often becomes a primary shorthand for how optimistic or cautious the market feels about future profits.
Here the picture is mixed. The current P/E of 11.8x sits well below the US Commercial Services industry average of 18.4x and also below a peer average of 32.4x. This points to a materially lower earnings multiple than many competitors. At the same time, the estimated fair P/E of 8.6x is meaningfully lower than 11.8x. This signals a level the market could move towards if sentiment cools and earnings expectations reset closer to that fair ratio.
Explore the SWS fair ratio for Healthcare Services Group.
Result: Price-to-Earnings of 11.8x (ABOUT RIGHT)
Still, Healthcare Services Group carries clear risks, including annual net income that declined 13.4% and a 5 year total shareholder return that slipped about 4%.
Find out about the key risks to this Healthcare Services Group narrative.
Another View: Healthcare Services Group Through A Cash Flow Lens
The earnings multiple paints Healthcare Services Group as reasonably priced, yet the SWS DCF model points in a different direction. On that framework, HCSG at $21.13 sits below an estimated future cash flow value of $34.52, which implies the stock trades at a sizeable discount.
This second approach leans on long term cash generation rather than a single year of earnings. It raises a practical question for investors. Is the gap between price and that DCF value a margin of safety, or a signal that future expectations might still be too optimistic?
Look into how the SWS DCF model arrives at its fair value.
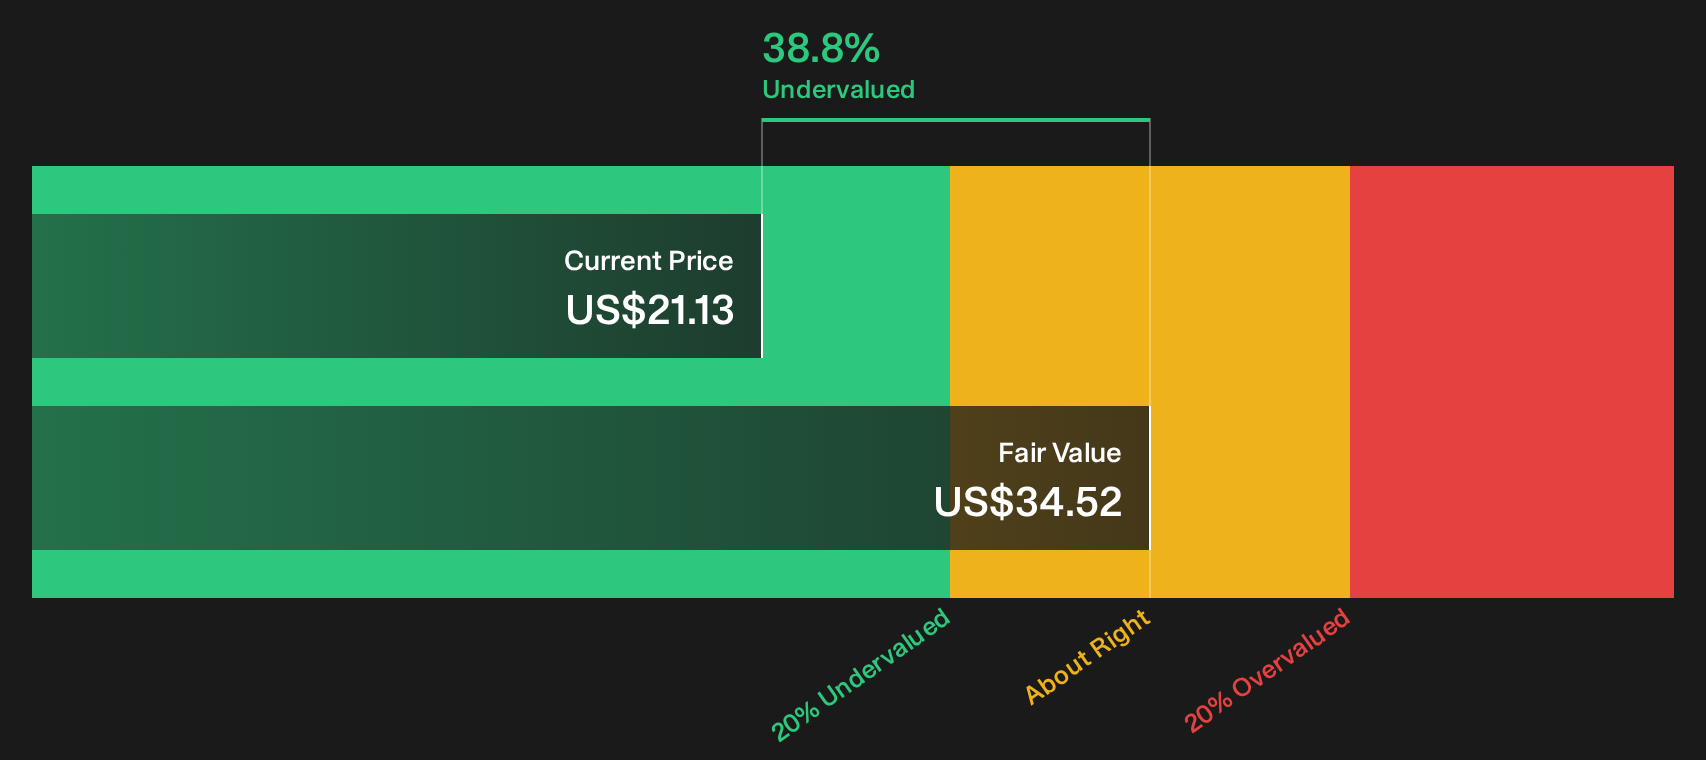
Simply Wall St performs a discounted cash flow (DCF) on every stock in the world every day (check out Healthcare Services Group for example). We show the entire calculation in full. You can track the result in your watchlist or portfolio and be alerted when this changes, or use our stock screener to discover 27 high quality undervalued stocks. If you save a screener we even alert you when new companies match - so you never miss a potential opportunity.
Next Steps
If this mix of optimism and concern around Healthcare Services Group feels familiar, act on your curiosity now and stress test the numbers yourself. A simple place to start is by weighing the 3 key rewards and 2 important warning signs.
Looking for more Healthcare Services Group style ideas?
Do not stop with Healthcare Services Group. Use the Simply Wall St screener to quickly surface other candidates that might better match your risk and return preferences.
- Target reliable cash generators by reviewing companies in the list of solid balance sheet and fundamentals (25 results) that pair healthier finances with fundamental strength.
- Hunt for underappreciated opportunities by scanning the 19 high quality undiscovered gems that combine quality metrics with relatively low market attention.
- Dial back volatility and focus on capital preservation by filtering for the 31 resilient stocks with low risk scores that carry stronger overall risk scores.
This article by Simply Wall St is general in nature. We provide commentary based on historical data and analyst forecasts only using an unbiased methodology and our articles are not intended to be financial advice. It does not constitute a recommendation to buy or sell any stock, and does not take account of your objectives, or your financial situation. We aim to bring you long-term focused analysis driven by fundamental data. Note that our analysis may not factor in the latest price-sensitive company announcements or qualitative material. Simply Wall St has no position in any stocks mentioned.
Have feedback on this article? Concerned about the content? Get in touch with us directly. Alternatively, email editorial-team@simplywallst.com