


Interactive Brokers Group has delivered very strong long term share gains, which puts fresh attention on a basic question for anyone looking at the stock today. Is the current price adequately supported by the broker's earnings power, or has enthusiasm for its business moved ahead of what the income statement can justify?
- Over the past 5 years the stock has returned about 4x, so any fresh position now rests heavily on what those gains imply about the earnings investors are willing to pay for.
- Management plans to discuss upcoming financial results on an earnings call scheduled for October 15, 2026, and those comments may shape how investors think about profit durability and the level of earnings that should underpin the valuation.
- Your read on Interactive Brokers Group is one view; the desks covering it have another. See what analysts think Interactive Brokers Group's shares could be worth.
The issue now is whether the earnings that Interactive Brokers generates today, and what investors expect it to produce next, are enough to justify the current share price.
If you are weighing Interactive Brokers Group against other opportunities that also turn on earnings power, it helps to see how similar ideas line up across 29 high quality undervalued stocks.
Does Interactive Brokers Group Look Pricey on Earnings?
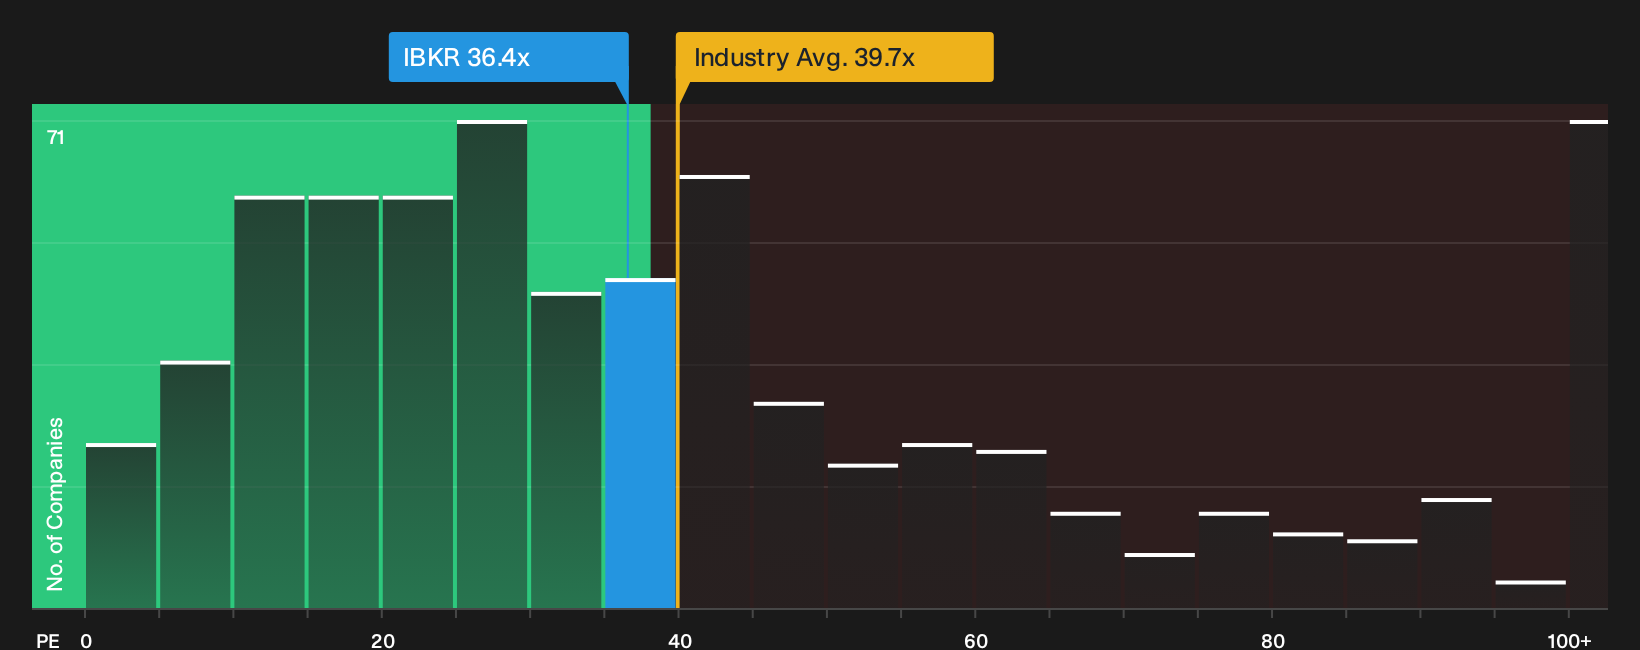
For a broker like Interactive Brokers Group that leans heavily on fee and interest income, the P/E ratio gives a straightforward read on what investors are paying for each dollar of earnings. The stock trades on a P/E of about 35.3x, which is higher than both the Capital Markets industry average of roughly 39.7x and the peer group at around 23.3x, so the market is attaching a relatively rich earnings tag compared with many similar businesses.
The fair P/E level implied by the valuation model, which blends the company’s projected returns, risk profile and sector norms, sits below the current multiple. As a result, the shares screen as overvalued on this framework. Because Interactive Brokers is set to discuss its third quarter numbers on October 15, 2026, the upcoming call may test whether recent results and guidance line up with a valuation that already asks buyers to pay a premium earnings multiple. Explore the numbers behind Interactive Brokers Group's P/E valuation.
The Interactive Brokers Group Narrative: What Would Justify Today's Price?
Narratives for Interactive Brokers Group pick up where the valuation puzzle leaves off by spelling out which future paths for growth, margins and earnings would need to hold for the shares to end up meaningfully higher or lower than today’s price, all hosted on Simply Wall St’s Community page. Each narrative treats Interactive Brokers Group's implied worth as a thesis about the business that can be tracked over time rather than a one-off snapshot.
Community views on Interactive Brokers Group split between those who see room left in the tank and those who think the market has already paid up.
Bull case: 17% undervalued
"Record client equity of about $930b and uninvested cash balances of about $182b, combined with higher margin lending and securities lending activity, create a larger base of client funds that can be monetised through interest and lending spreads..."
Discover why this Narrative puts Interactive Brokers Group at 17% undervalued.
Bear case: 482% overvalued
"Another risk to monitor is interest rate sensitivity... income from margin loans and idle client cash could compress, putting pressure on earnings unless trading activity remains strong..."
Explore why this Narrative puts Interactive Brokers Group at 482% overvalued.
One more piece of the Interactive Brokers Group puzzle before you act
Price, profits and narratives only go so far if you have not examined who is steering Interactive Brokers Group and how their pay lines up with your interests. See who runs Interactive Brokers Group and how they are paid.
This article by Simply Wall St is general in nature. We provide commentary based on historical data and analyst forecasts only using an unbiased methodology and our articles are not intended to be financial advice. It does not constitute a recommendation to buy or sell any stock, and does not take account of your objectives, or your financial situation. We aim to bring you long-term focused analysis driven by fundamental data. Note that our analysis may not factor in the latest price-sensitive company announcements or qualitative material. Simply Wall St has no position in any stocks mentioned.
Have feedback on this article? Concerned about the content? Get in touch with us directly. Alternatively, email editorial-team@simplywallst.com