


Realty Income (O) has been in focus after raising full year guidance in August and launching a joint venture with KKR in September, even as the share price has retreated in recent months.
For Realty Income, the recent headlines are landing against a backdrop of weaker momentum, with the 30 day share price return down 12.9% and the 90 day share price return down 15.6%, even though the 3 year total shareholder return of 23.7% remains positive. Investors appear to be reassessing near term risk and rate sensitivity. At the same time, the raised full year outlook, high occupancy and long dividend track record keep the longer term income story in focus around the current US$53.35 share price.
Scan beyond Realty Income and compare its setup to hand picked real estate and income plays in our 7 dividend fortresses for investors who want yield backed by resilient cash flows.
Realty Income now trades well below both analyst targets and some fair value estimates after that pullback. Is this simply rate anxiety overshooting, or is it a level that better reflects the risks on the table?
Most Popular Narrative: 14% Undervalued
On the most followed valuation view, Realty Income screens as undervalued, with a narrative fair value of $62.11 against the recent $53.35 share price.
Given the fact that Realty Income is a dividend focused company, I will value it using only valuation methods related with dividends. A fundamentally driven one and then a historical/relative one to sanity check.
See why 105 investors see Realty Income as 14% undervalued.
According to andre_santos, that framework leans heavily on Realty Income's dividend history, with one method using a Dividend Discount Model and another comparing the current yield with its own past levels. The blended outcome points to a fair value of $62.11, which sits meaningfully above the current market quote even after recent volatility.
The same narrative flags that this kind of dividend focused valuation carries plenty of moving parts, from cost of equity assumptions to how quickly payouts might grow. As a result, the 14.1% implied discount is not a hard line. It is instead a reference point for readers weighing a 6.1% indicated yield against slower forecast revenue growth of 3.7% per year and earnings growth estimates of 10.8% per year.
Result: Fair Value of $62.11 (UNDERVALUED)
Still, higher funding costs and a projected cost of capital above historical ROIC leave little room for error if Realty Income's growth or occupancy assumptions slip.
Find out about the key risks to this Realty Income narrative.
Another View: Realty Income On Earnings Multiples
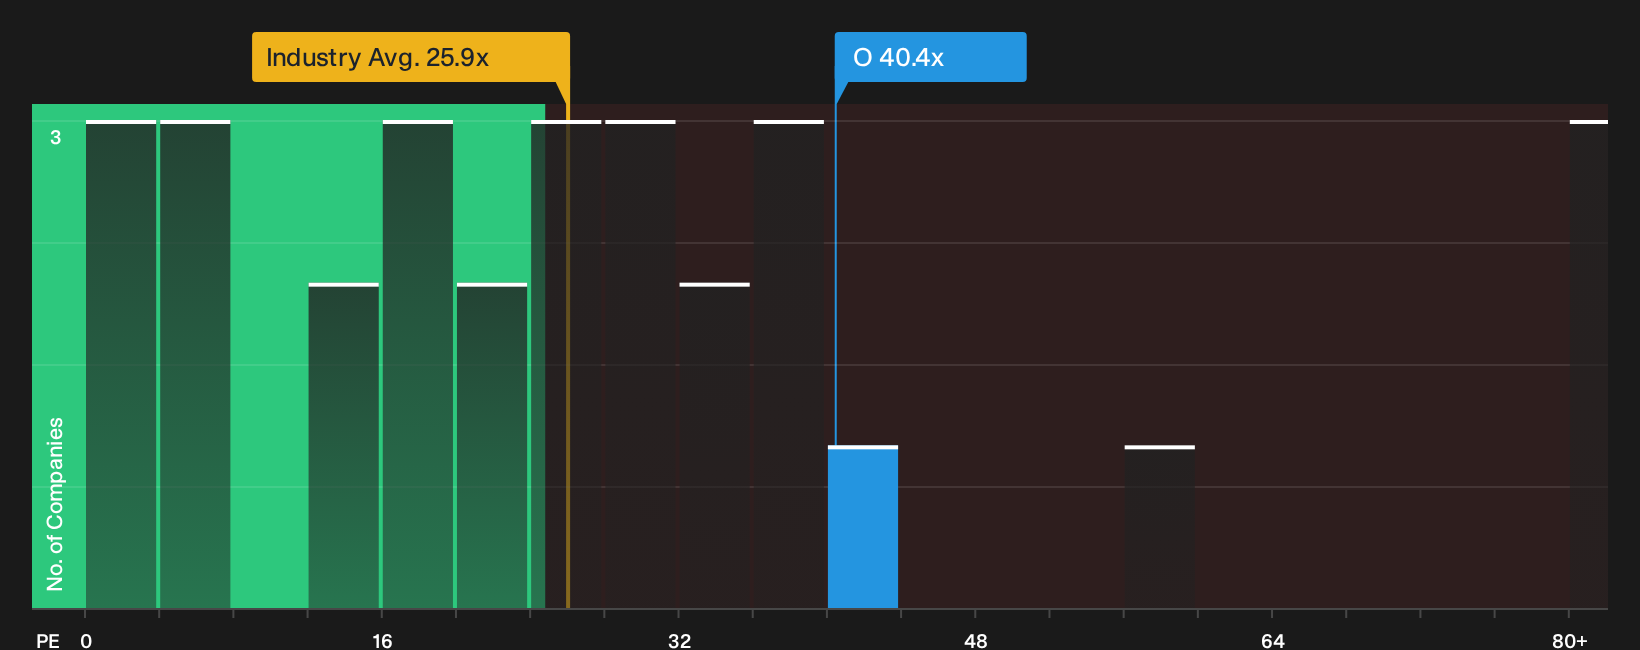
That dividend heavy fair value of $62.11 paints Realty Income as undervalued, yet the earnings based yardstick tells a different story. The stock trades on a P/E of 39.7x versus 25.9x for the US Retail REITs sector and 25.1x for peers, while the fair ratio sits at 35.2x. For income investors, that richer multiple can mean paying up today for a payout stream that is forecast to grow more slowly than the wider market. The question is whether the yield and perceived resilience justify that premium.
Before leaning on one method or the other, it helps to see how the current price lines up against our valuation breakdown and where the market could move if that P/E drifts toward the fair ratio. See what the numbers say about this price — find out in our valuation breakdown.
Next Steps
Mixed signals around Realty Income are clear, so move fast, work through the full data set, and weigh the 5 key rewards and 1 important warning sign.
Ready For More Income Ideas Beyond Realty Income?
If Realty Income has sharpened your focus on yield, do not stop here. Use fresh screeners to quickly surface other opportunities that might fit your goals.
- Target dependable payouts by scanning a curated pool of high yield candidates in the 7 dividend fortresses that put steady income front and center.
- Hunt for potential mispricing and compare quality metrics by running through the 29 high quality undervalued stocks that filters for stronger fundamentals at lower tags.
- Prioritise durability and sleep better at night by leaning on the list of solid balance sheet and fundamentals (25 results) that filters for sturdier finances and healthier cushions.
This article by Simply Wall St is general in nature. We provide commentary based on historical data and analyst forecasts only using an unbiased methodology and our articles are not intended to be financial advice. It does not constitute a recommendation to buy or sell any stock, and does not take account of your objectives, or your financial situation. We aim to bring you long-term focused analysis driven by fundamental data. Note that our analysis may not factor in the latest price-sensitive company announcements or qualitative material. Simply Wall St has no position in any stocks mentioned.
Have feedback on this article? Concerned about the content? Get in touch with us directly. Alternatively, email editorial-team@simplywallst.com