


Recent Price Moves Put Chartwell Retirement Residences In Focus
Recent market attention on Chartwell Retirement Residences (TSX:CSH.UN) has been driven by its mixed return profile, with the unit price at CA$19.44 and performance varying sharply across recent periods.
Over the past week the trust is down about 5%, with the unit price also lower over the past month and past 3 months. At the same time, longer horizons show modest 1 year gains and much stronger 3 and 5 year total returns, which gives investors a very different picture.
Short term momentum for Chartwell Retirement Residences is fading, with the unit price down over the past week, month and quarter. However, the 1 year total shareholder return of 0.79% and very strong 3 and 5 year total shareholder returns above 100% show a far more resilient long run picture.
Scan hand picked, resilient income generators that echo Chartwell Retirement Residences' profile by reviewing the 2 dividend fortresses.Chartwell Retirement Residences now trades well below the average analyst target, even after a strong multi year run. Is this recent pullback a sign of misplaced caution or a fair discount to its fundamentals?
Most Popular Narrative: 25% Undervalued
The most followed narrative on Chartwell Retirement Residences places fair value at CA$25.95 per unit, compared to the recent CA$19.44 close. That gap depends on whether the business can turn its current portfolio moves into much stronger earnings over time.
Chartwell's operational scale and expanding service offerings (wellness programs, memory care, tech integration) are deepening customer value and allowing for diversified revenue streams per resident, insulating performance against industry variability and supporting long-term revenue and earnings growth.
See why 20 investors see Chartwell Retirement Residences as 25% undervalued.
Result: Fair Value of CA$25.95 (UNDERVALUED)
Still, elevated leverage and refinancing risk, combined with labour cost pressures, could quickly challenge the upbeat narrative around Chartwell Retirement Residences.
Find out about the key risks to this Chartwell Retirement Residences narrative.
Another View On Chartwell Retirement Residences’ Valuation
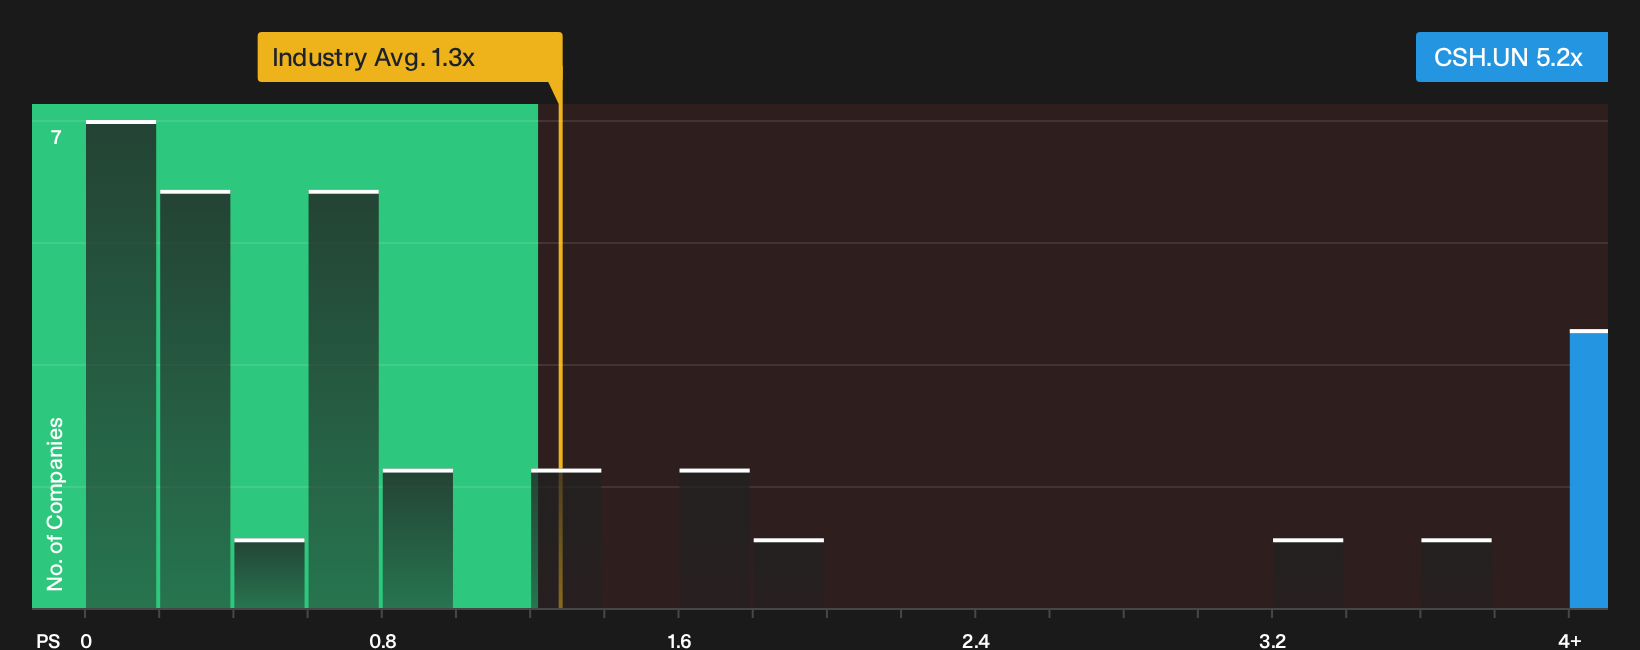
The first narrative leans on fair value estimates around CA$25.95 per unit, yet Chartwell Retirement Residences looks expensive when judged by its P/S ratio of 5.2x. That is well above the North American Healthcare industry at 1.3x, the peer average at 1.2x, and the fair ratio of 3.2x.
Such a large premium suggests the market is already pricing in a lot of the good news. This raises a simple question for investors: How confident are you that future execution will be strong enough to keep that gap from closing on the downside?
See what the numbers say about this price — find out in our valuation breakdown.
Next Steps
Mixed signals around Chartwell Retirement Residences can be confusing, so review the data, consider different perspectives, and weigh both sides for yourself with 2 key rewards and 4 important warning signs.
Looking for more investment ideas beyond Chartwell Retirement Residences?
If Chartwell Retirement Residences has your attention, do not stop there. Broaden your watchlist with other focused ideas that could sharpen your overall portfolio.
- Target resilience first and scan a curated set of 8 resilient stocks with low risk scores that prioritize steadier risk profiles over headline excitement.
- Hunt for value and review a 7 high quality undervalued stocks list that blends quality fundamentals with prices that sit below many investors’ radar.
- Spot potential early and sort through a 9 high quality undiscovered gems that highlights companies with solid financial footing yet limited market attention.
This article by Simply Wall St is general in nature. We provide commentary based on historical data and analyst forecasts only using an unbiased methodology and our articles are not intended to be financial advice. It does not constitute a recommendation to buy or sell any stock, and does not take account of your objectives, or your financial situation. We aim to bring you long-term focused analysis driven by fundamental data. Note that our analysis may not factor in the latest price-sensitive company announcements or qualitative material. Simply Wall St has no position in any stocks mentioned.
Have feedback on this article? Concerned about the content? Get in touch with us directly. Alternatively, email editorial-team@simplywallst.com