


Zillow Group (ZG) just put fresh numbers around a split housing story. Buyers face softer sales and higher mortgage costs, while rental demand and rents show clear strength across many U.S. markets.
That split story is showing up in the trading screen too. Zillow Group’s share price is now US$27.97, and the stock has fallen sharply with a year to date share price decline of 57.37% and a 1 year total shareholder return decline of 59.40%. At the same time, its data on cooling home sales and firmer rents shapes how investors think about both growth potential and housing related risk.
Spot emerging housing plays that are not in the headlines yet by scanning our 20 high quality undiscovered gems, focusing on those with strong fundamentals and potential leverage to the same affordability and rental trends Zillow Group is tracking.Zillow Group now trades at a deep discount to both analyst targets and some intrinsic value estimates after a steep slide. Is that an overreaction to housing risk, or a fair reset that keeps the stock cheap for a reason?
Most Popular Narrative: 41% Undervalued
Zillow Group is framed by the most followed narrative as materially undervalued, with a fair value of $47.23 against the last close at $27.97. This view puts significant emphasis on its rental and software ecosystem to carry more of the story over time.
The shift toward integrated, end to end digital transaction ecosystems (like Zillow 360 and Enhanced Markets) is enabling Zillow to capture more ancillary services revenue (mortgages, rentals, software), reducing dependence on advertising and expanding top line growth as well as supporting EBITDA margin expansion through operational efficiencies.
See why 27 investors see Zillow Group as 41% undervalued.
Result: Fair Value of $47.23 (UNDERVALUED)
Still, the Zillow Group story can change quickly if housing transactions remain muted for longer or if commission rule changes weigh more heavily on Premier Agent spending.
Find out about the key risks to this Zillow Group narrative.
Another View: Zillow Group Looks Expensive On Earnings
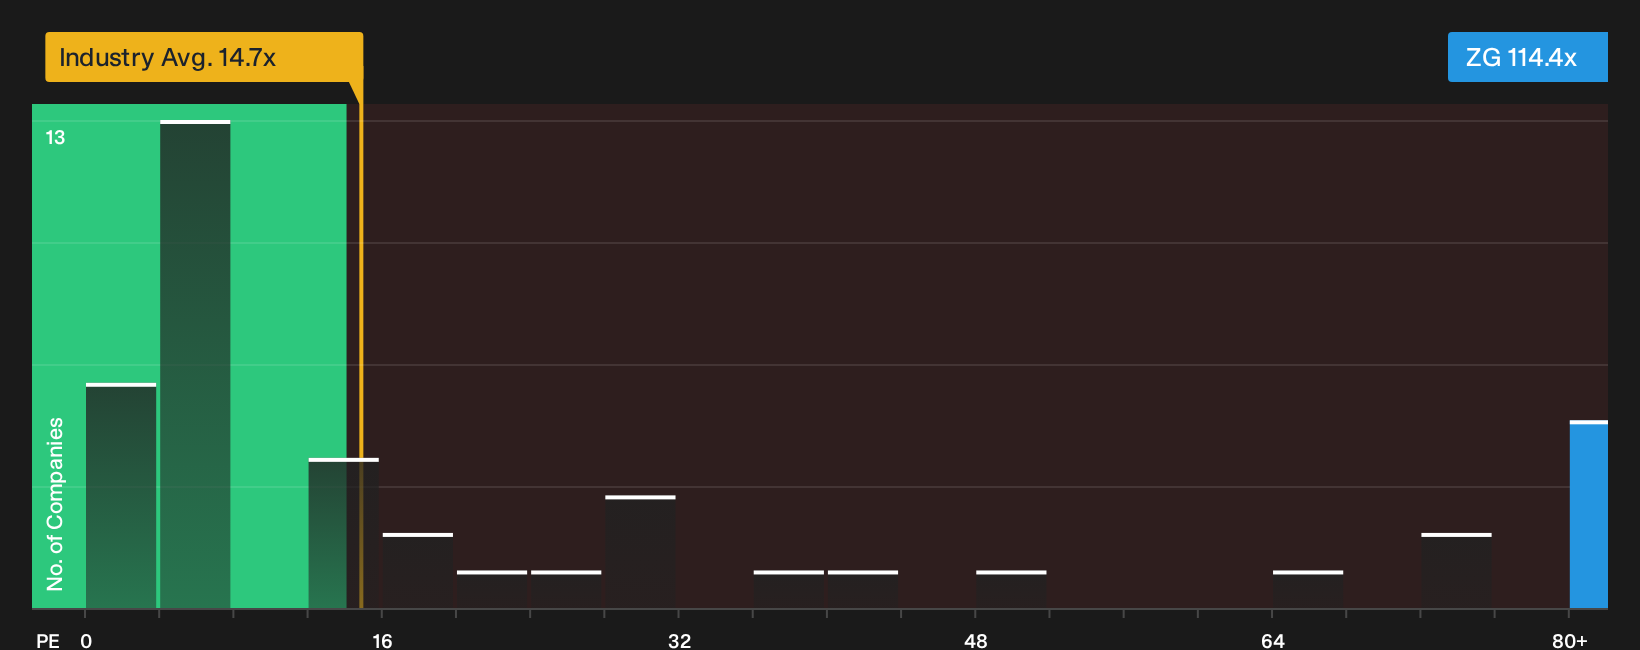
There is a sharp contrast when you look at Zillow Group through a simple earnings lens. The stock trades on a P/E of 114.4x, while the fair ratio is 48.2x, the US Real Estate industry is at 15.1x and close peers average 70.7x. That gap points to meaningful valuation risk if sentiment cools or growth expectations soften.
See what the numbers say about this price — find out in our valuation breakdown.
Next Steps
Mixed signals around Zillow Group's valuation and housing exposure create a split view, so move quickly to weigh the data yourself and see whether the trade off between caution and optimism makes sense. For a structured snapshot of both sides of that debate, review the 3 key rewards and 1 important warning sign.
Looking for more investment ideas beyond Zillow Group?
Do not stop with a single housing story. Broader opportunity sits across the market, and a focused screener can help you quickly surface candidates that fit your style.
Use the Simply Wall St tools to scan for fresh ideas that match your risk appetite, income goals, or value focus before the crowd pays attention.
- Target potential mispricings by reviewing companies on the 29 high quality undervalued stocks that pair solid fundamentals with lower implied expectations.
- Lock in income-focused ideas by filtering for dependable payers through the 8 dividend fortresses that emphasises higher yields backed by underlying financial strength.
- Prioritise resilience by concentrating on businesses within the 31 resilient stocks with low risk scores that score well on balance sheet quality and risk factors.
This article by Simply Wall St is general in nature. We provide commentary based on historical data and analyst forecasts only using an unbiased methodology and our articles are not intended to be financial advice. It does not constitute a recommendation to buy or sell any stock, and does not take account of your objectives, or your financial situation. We aim to bring you long-term focused analysis driven by fundamental data. Note that our analysis may not factor in the latest price-sensitive company announcements or qualitative material. Simply Wall St has no position in any stocks mentioned.
Have feedback on this article? Concerned about the content? Get in touch with us directly. Alternatively, email editorial-team@simplywallst.com