


Nasdaq (NDAQ) is back in focus after a cluster of fresh updates, including new September and quarter operational metrics, an AI framework for its Calypso platform, and an expanded clearing relationship with HSBC.
Nasdaq’s recent product updates and client wins are landing against a mixed tape. The share price is at US$91.93 and has fallen about 5.1% over the past month, although the 90 day share price return of 5% and 3 year total shareholder return of about 93% point to momentum that has built over a longer stretch as investors respond to both growth initiatives and changing views on risk around market infrastructure and financial technology providers.
Spot fresh momentum plays by comparing Nasdaq’s recent AI and clearing moves with a hand picked group of 91 AI infrastructure stocks powering market and trading infrastructure.Nasdaq now trades about 19% below the average analyst price target, even though an intrinsic value estimate points to a small premium. Is that gap a straightforward opportunity, or is the market pricing in real execution risk around these AI and clearing bets?
Most Popular Narrative: 11.8% Undervalued
Nasdaq’s most followed narrative pins fair value at $104.19 against the last close of $91.93, which puts the current price at a clear discount while still asking investors to weigh how durable its earnings profile and AI push really are.
Four crashes, four different causes, four different recovery timelines, two years, fifteen years, years, months. If there were a reliable way to know in real time which kind you were in, that would be worth more than almost anything else in investing. Nobody has reliably had that in any of these four cases. What every one of them rewarded instead was the boring stuff: not being leveraged past what you could survive, having a plan for how much you were willing to lose before you needed to act on it, and not needing to guess correctly about the recovery shape to avoid being wiped out waiting for it.
See why 6 investors see Nasdaq as 12% undervalued.
According to zonedinout, that fair value estimate is built using a discount rate of 8.15% and bakes in forecast revenue growth of about 7.2% a year with profit margins around 35%. The narrative effectively says the market is paying around $92 today for a business whose cash flows and profitability profile could justify roughly $104, once those projected earnings and margins are discounted back at that hurdle rate.
The same storyline leans heavily on Nasdaq’s ability to keep compounding profit at a measured pace rather than chasing rapid expansion. Earnings are forecast to rise about 8.7% per year and that path is framed as consistent with a mature market infrastructure and financial technology platform that already generates around $5.6b of annual revenue and $1.97b of net income.
There is a tension running through the thesis. The narrative labels Nasdaq as undervalued overall, yet Simply Wall St’s own cash flow model currently points to a future cash flow value of $87.12, which sits below the last close. That gap underlines how sensitive any fair value number can be to assumptions around growth, margins, and required returns.
Investors weighing this story have several concrete data points to work with. Net profit margin sits near 35%, up from 30.7% last year, earnings have grown about 10.3% per year over the past 5 years, and growth in the most recent year of 30.4% sits well above that 5 year pace. At the same time, revenue and profit are both forecast to grow slower than the broader US market, and the balance sheet carries a high level of debt funded entirely through external borrowing, which is a higher risk funding mix than customer deposits.
Governance and earnings quality form another pillar of the prevailing view. The board is considered experienced with an average tenure of 8.5 years and a high degree of independence at 92%, while the management team averages 5.6 years in their roles. Earnings are assessed as high quality, and return on equity is forecast to move from a current 16.4% that is described as low to a higher 21.3% in three years, although analyst forecasts overall are treated cautiously because the target price is less than 20% above the present share price.
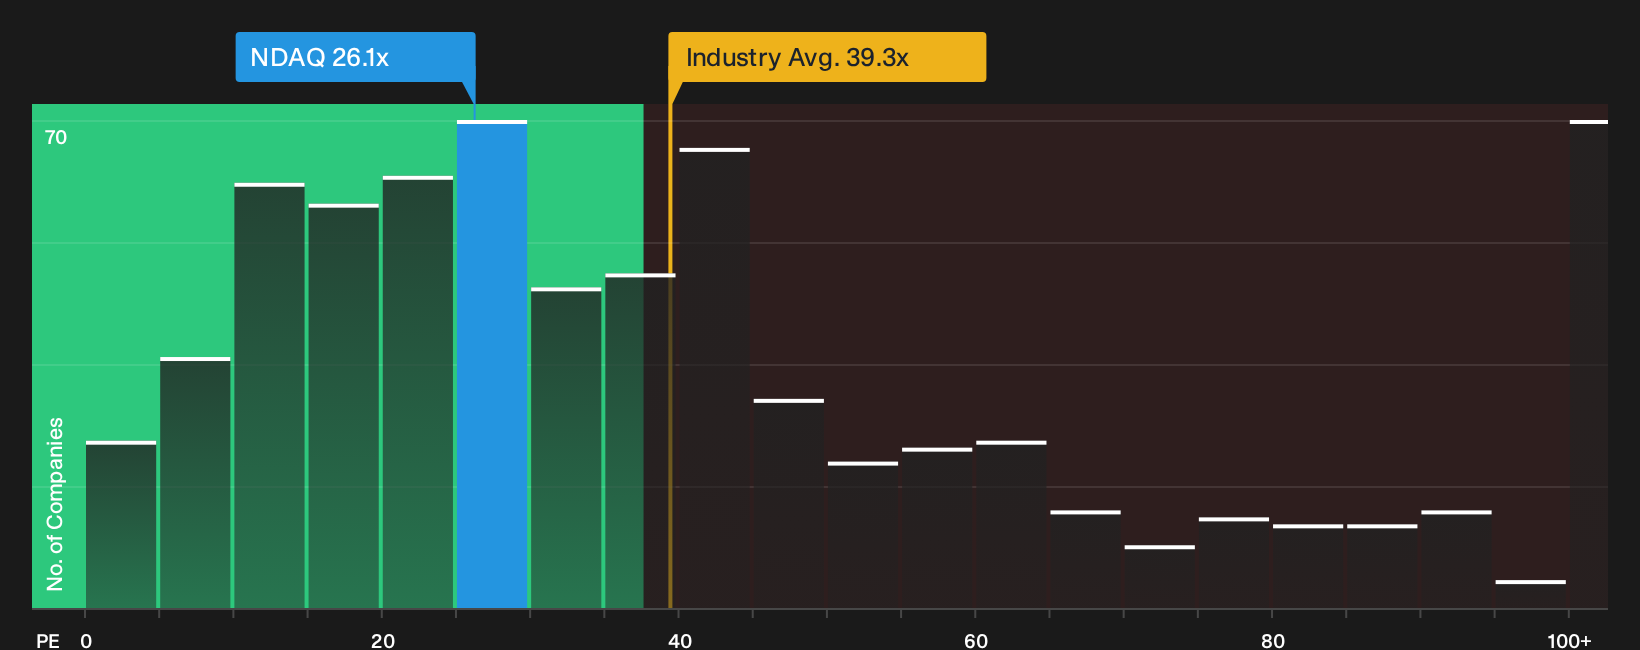
That leaves valuation as a trade off. The stock trades on a P/E of 26.1x, which is lower than the US Capital Markets industry average of 39.3x but slightly higher than the 25.2x peer average and materially above an estimated fair P/E of 14.9x. So the popular narrative tags Nasdaq as about 11.8% undervalued versus its $104.19 fair value, while other checks flag a rich earnings multiple and a DCF estimate below the current share price.
Result: Fair Value of $104.19 (UNDERVALUED)
Still, the story can break if Nasdaq’s high debt load collides with weaker trading volumes, or if the AI and Calypso projects underdeliver against expectations.
Find out about the key risks to this Nasdaq narrative.
Another View: Nasdaq Through The P/E Lens
There is a very different story if you value Nasdaq using its P/E level rather than the fair value narrative. The shares trade at 26.1x earnings, which is cheaper than the US Capital Markets group at 39.3x, yet richer than peers at 25.2x and well above a fair ratio of 14.9x. That mix points to real pricing risk if sentiment shifts toward that lower fair ratio. How much conviction do you have in paying up for this earnings profile?
See what the numbers say about this price in our valuation breakdown, then compare Nasdaq with a broader set of peers to stress test your view See what the numbers say about this price — find out in our valuation breakdown.
Next Steps
Mixed signals on Nasdaq often create the best testing ground for your own process, so move quickly, pressure test the numbers, and then weigh up the balance of 3 key rewards and 2 important warning signs.
Looking For More Nasdaq Investment Ideas?
If you want fresh angles beyond Nasdaq alone, use the Simply Wall St Screener to quickly surface focused opportunities before other investors start paying attention.
- Target potential mispricing by scanning a curated set of quality companies trading below intrinsic value through the 29 high quality undervalued stocks.
- Lock in potential income streams by zeroing in on companies described as yield fortresses via the 8 dividend fortresses.
- Sleep easier at night by filtering for businesses assessed as resilient with lower risk profiles using the 31 resilient stocks with low risk scores.
This article by Simply Wall St is general in nature. We provide commentary based on historical data and analyst forecasts only using an unbiased methodology and our articles are not intended to be financial advice. It does not constitute a recommendation to buy or sell any stock, and does not take account of your objectives, or your financial situation. We aim to bring you long-term focused analysis driven by fundamental data. Note that our analysis may not factor in the latest price-sensitive company announcements or qualitative material. Simply Wall St has no position in any stocks mentioned.
Have feedback on this article? Concerned about the content? Get in touch with us directly. Alternatively, email editorial-team@simplywallst.com