


Ball (BALL) is heading into a fresh information moment, with third quarter 2026 results scheduled for November 3 before the market opens and a conference call set for that morning.
Recent trading paints a mixed picture for Ball, with a 7-day share price return of 2.59% but a 30-day move down 8.28%, while the year to date share price return of 7.74% sits alongside a 1-year total shareholder return of 19.68% and a 3-year total shareholder return of 30.26%. This suggests momentum has cooled in the short term even as longer term holders have still seen gains.
Scan beyond Ball and see how other packaging and materials players are setting up for their next move with our curated list of list of solid balance sheet and fundamentals (25 results).
Recent weakness at Ball could be read as investors cooling on the story rather than the enterprise losing its edge. The valuation work starts with separating those two signals.
Most Popular Narrative: 21% Undervalued
Ball last closed at $57.48, while the most widely followed narrative anchors fair value around $72.57. This frames upcoming results against a valuation gap built on measured cash flow expectations rather than headline momentum.
Post divestiture focus on core aluminum packaging and the roll out of the Ball Business System, which now targets $500 million of gross productivity savings by the end of 2026 and ongoing 1% to 2% annual supply chain cost reductions, supports the earlier view that tighter cost control and capital discipline can lift net margins and earnings without requiring outsized volume growth.
See why 9 investors see Ball as 21% undervalued.
Result: Fair Value of $72.57 (UNDERVALUED)
Still, the Ball narrative frays quickly if input costs stay volatile or if customer concentration in South America turns contract risk into real earnings pressure.
Find out about the key risks to this Ball narrative.
Another View On Ball’s Valuation
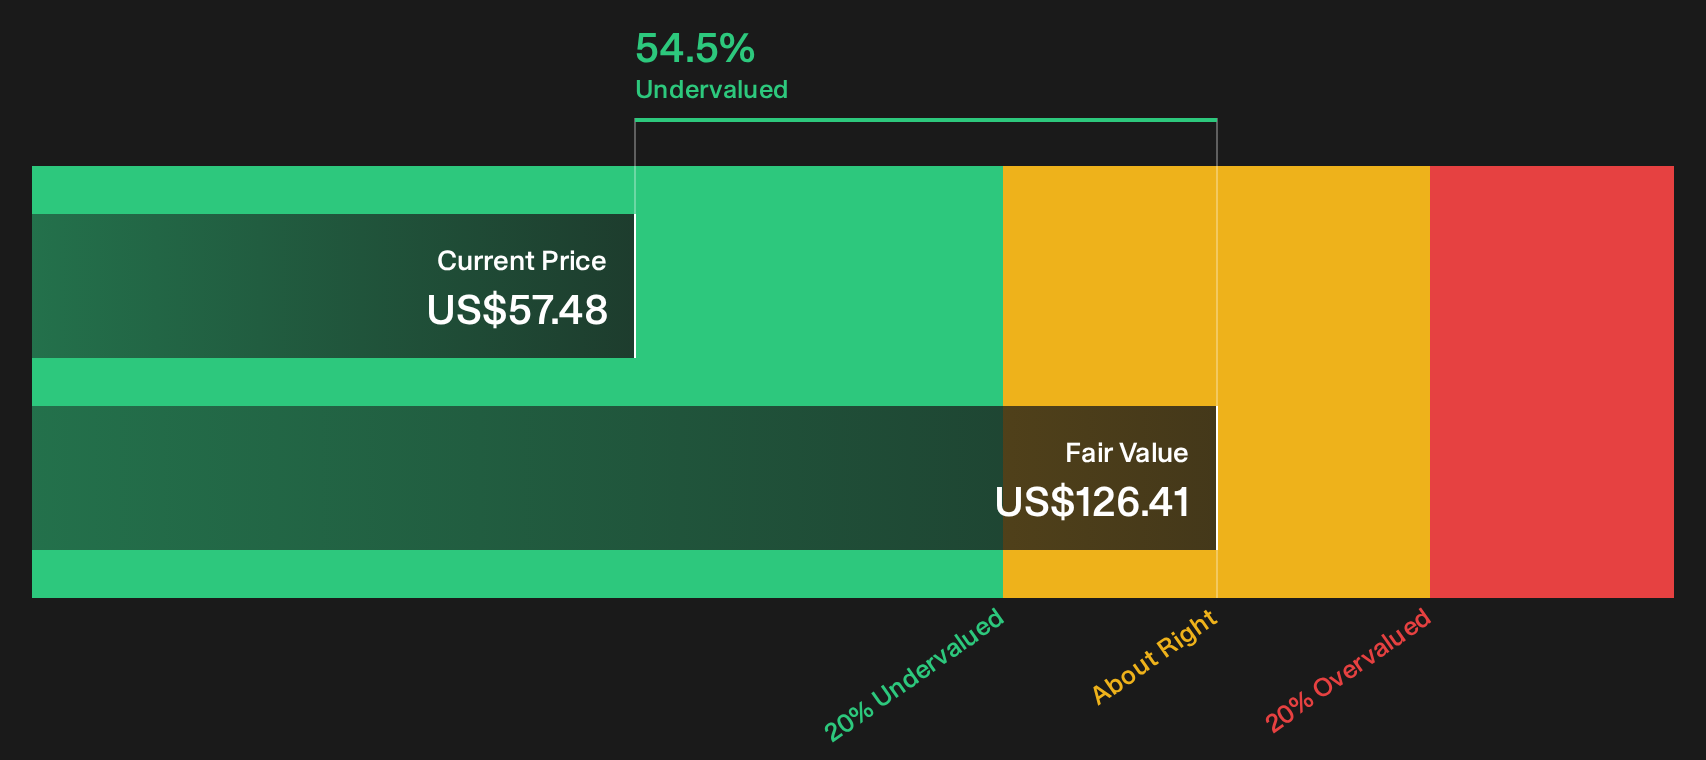
Ball screens as undervalued on future cash flows, with our DCF work indicating the shares trade 54.5% below an estimated future cash flow value of $126.41. That is a far bigger cushion than the 21% gap implied by the fair value narrative. Which gap feels more realistic to you?
Look into how the SWS DCF model arrives at its fair value.
Next Steps
Mixed messages on Ball can be useful if you move quickly and inspect the underlying data yourself instead of inheriting someone else’s conviction. To see how the positives stack up against the red flags, start with the 5 key rewards and 1 important warning sign.
Looking for more investment ideas beyond Ball?
Do not stop with Ball. Broaden your watchlist using structured tools that surface clear opportunities instead of relying on scattered tips or social media noise.
- Target steady compounding potential by reviewing companies that pass strict value and quality filters in the 29 high quality undervalued stocks screener.
- Prioritise resilience by focusing on businesses that score well on financial strength in the 31 resilient stocks with low risk scores results.
- Hunt for tomorrow’s potential standouts by checking the 20 high quality undiscovered gems list before other investors start paying attention.
Serious investors keep fresh ideas flowing. Take a few minutes now to scan these screeners before the most compelling setups move out of reach.
This article by Simply Wall St is general in nature. We provide commentary based on historical data and analyst forecasts only using an unbiased methodology and our articles are not intended to be financial advice. It does not constitute a recommendation to buy or sell any stock, and does not take account of your objectives, or your financial situation. We aim to bring you long-term focused analysis driven by fundamental data. Note that our analysis may not factor in the latest price-sensitive company announcements or qualitative material. Simply Wall St has no position in any stocks mentioned.
Have feedback on this article? Concerned about the content? Get in touch with us directly. Alternatively, email editorial-team@simplywallst.com