


Recent Share Performance And Business Mix
Nelnet (NNI) has drawn fresh attention after recent trading left the stock down about 2% over the past month and roughly 6% over the past 3 months, even as long term returns remain positive.
The business now carries a market value of about US$4.45b, with the latest close at US$124.52 per share on 7 October 2026. That price reflects a group of diverse activities that go well beyond its original roots in student loan servicing.
Across its four main operating areas, Loan Servicing and Systems, Education Technology Services and Payments, Asset Generation and Management, and Nelnet Bank, management reported total revenue of US$1.49b and net income of US$302.24m, all generated in the United States.
The mix is spread across several lines, with Loan Servicing and Systems contributing US$550.62m and Education Technology Services and Payments adding US$542.11m. Asset Generation and Management accounted for US$177.69m, Nelnet Bank produced US$64.53m, and other operating segments plus corporate activities and eliminations made up the balance.
Recent trading in Nelnet points to fading momentum, with the share price return down 2.2% over the past month and 6% over the past quarter. However, the 5 year total shareholder return of 57% shows investors who stayed invested have still seen meaningful gains.
The modest decline in the year to date share price return of 3.5%, when set against that stronger multi year total shareholder return, suggests the market has been reassessing near term risks around its mix of loan servicing, education technology, and banking activities rather than abandoning the longer term story entirely.
Scan beyond Nelnet and line up other diversified financials under pressure with our hand picked 31 resilient stocks with low risk scores to see which balance sheets look more resilient right now.
Short term weakness and a share price sitting just below the analyst target raises a practical choice for Nelnet followers. Should they step in after this pullback, or hold out for a deeper reset before committing fresh capital?
Price-to-Earnings Of 14.7x: Is It Justified For Nelnet?
On simple headline maths, Nelnet trades on a P/E of 14.7x at a last close of $124.52, which is richer than both its Consumer Finance peers and its own estimated fair multiple, so the market is paying up for this stock relative to several benchmarks.
The P/E ratio compares the current share price with earnings per share and gives a quick read on how much investors are willing to pay for each dollar of profit. For a diversified financial group like Nelnet, with activities in servicing, education technology, asset management, and banking, this metric ties directly to how the market views the durability and quality of its current earnings stream.
Analysts expect NNI's earnings to grow about 1% per year while revenue is forecast to advance 10.8% per year, both below the broader US market outlook. This suggests the premium P/E is not being backed by stronger growth expectations. At the same time, the estimated fair P/E multiple of 9.7x is far lower than the current 14.7x. This points to a level the market could move toward if sentiment cools or if profitability does not improve from here.
Compared with the US Consumer Finance industry average P/E of 9x and a peer average of 9.5x, Nelnet looks clearly more expensive, so the stock is valued well above both sector and peer benchmarks on this earnings yardstick.
Explore the SWS fair ratio for Nelnet.
Result: Price-to-earnings of 14.7x (OVERVALUED)
Still, the rich P/E for Nelnet could be vulnerable if revenue growth slows from the recent 10.8% pace, or if net income stalls around US$302.24m.
Find out about the key risks to this Nelnet narrative.
Another View On Nelnet's Valuation
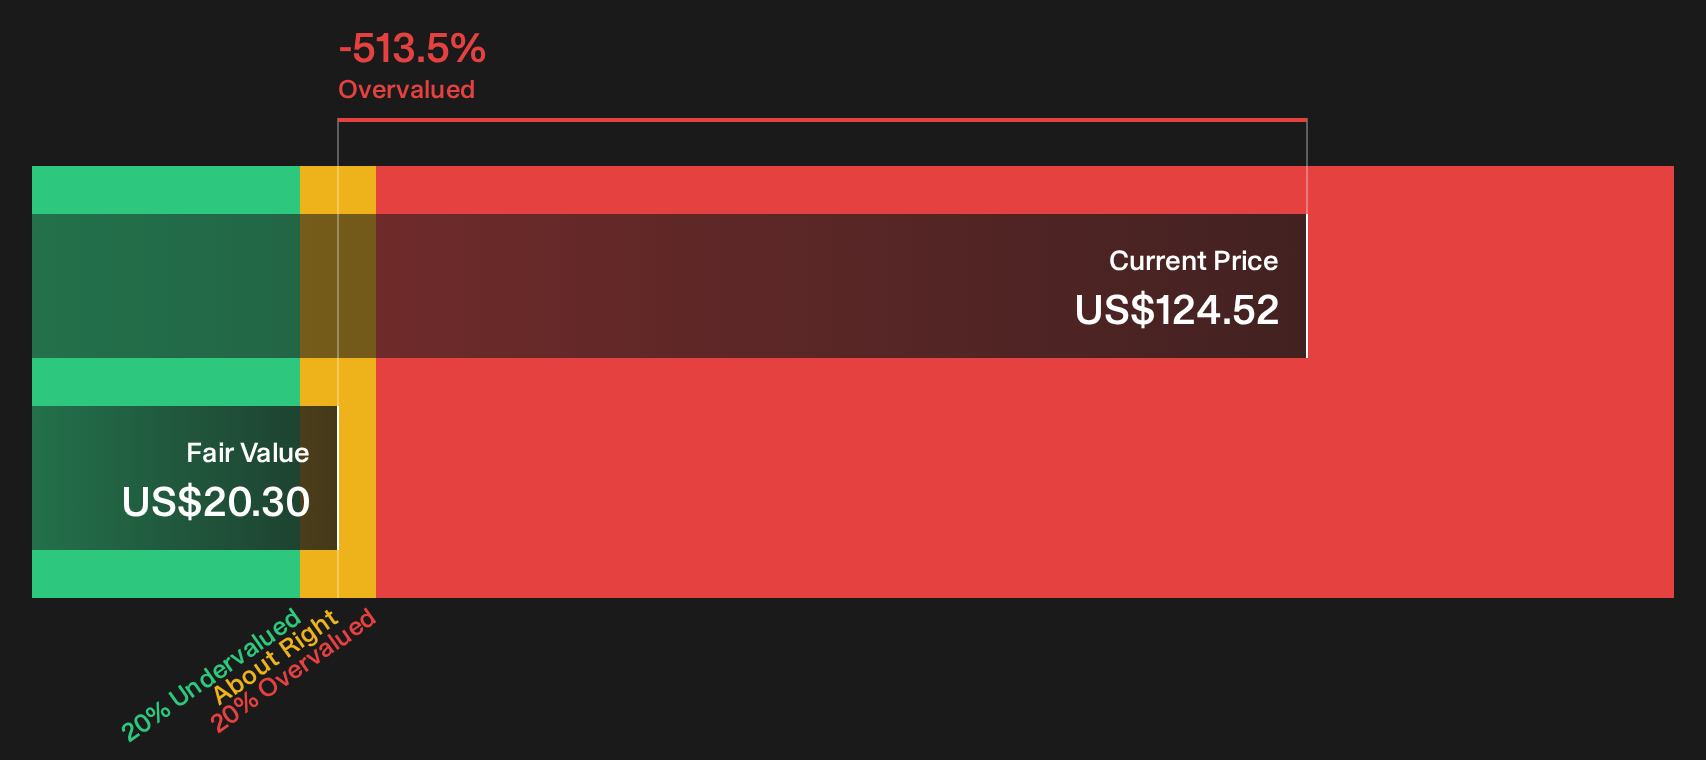
The P/E discussion presents Nelnet as expensive, yet the SWS DCF model is far harsher. It estimates future cash flow value at just $20.30 per share, compared with a market price of $124.52. That gap points to significant downside risk if investors begin to focus more on cash generation than on accounting earnings.
For anyone weighing that gap between earnings and cash flow, it helps to see how the SWS DCF model is built and what underlies the $20.30 estimate. Look into how the SWS DCF model arrives at its fair value.
Simply Wall St performs a discounted cash flow (DCF) on every stock in the world every day (check out Nelnet for example). We show the entire calculation in full. You can track the result in your watchlist or portfolio and be alerted when this changes, or use our stock screener to discover 29 high quality undervalued stocks. If you save a screener we even alert you when new companies match - so you never miss a potential opportunity.
Next Steps
Mixed signals around Nelnet's valuation and cash flows make this a moment to move quickly, review the underlying data, and decide where you stand based on both the potential upside and the open questions. To weigh those trade offs for yourself, start with the 1 key reward and 1 important warning sign
Looking For More Investment Ideas Beyond Nelnet?
Do not stop your research with Nelnet. Fresh opportunities keep appearing, and the investors who keep scanning the market usually see them first.
- Target long term compounding potential by reviewing a curated pool of quality companies trading below their estimated worth through the 29 high quality undervalued stocks.
- Strengthen your income stream by focusing on robust payouts and balance sheets using the 8 dividend fortresses.
- Keep risk in check by focusing on sturdier business profiles and financial resilience through the list of solid balance sheet and fundamentals (25 results).
This article by Simply Wall St is general in nature. We provide commentary based on historical data and analyst forecasts only using an unbiased methodology and our articles are not intended to be financial advice. It does not constitute a recommendation to buy or sell any stock, and does not take account of your objectives, or your financial situation. We aim to bring you long-term focused analysis driven by fundamental data. Note that our analysis may not factor in the latest price-sensitive company announcements or qualitative material. Simply Wall St has no position in any stocks mentioned.
Have feedback on this article? Concerned about the content? Get in touch with us directly. Alternatively, email editorial-team@simplywallst.com