


- CME Group reported a 22% year over year rise in international average daily volume in Q3 2026, with energy, agricultural, and equity index contracts all contributing and every major region, including EMEA, APAC, Canada, and Latin America, participating in the higher activity.
- The broad based pickup in overseas trading deepens CME Group’s reliance on global derivatives demand rather than any single product line or region. This can reshape how investors think about the durability of its transaction fee and market data engines.
- We will now look at how CME Group’s investment narrative could shift as international trading activity scales across major product lines.
CME Group Investment Narrative Recap
To own CME Group you need to be comfortable with a business whose fortunes are tightly linked to trading activity and volatility across futures and options, not to any single contract. The short term swing factor is whether high global volumes in rates, equity index, energy and agricultural products stay firm. The biggest near term risk is competitive pressure in benchmark contracts and any wobble in derivatives volumes if market activity cools.
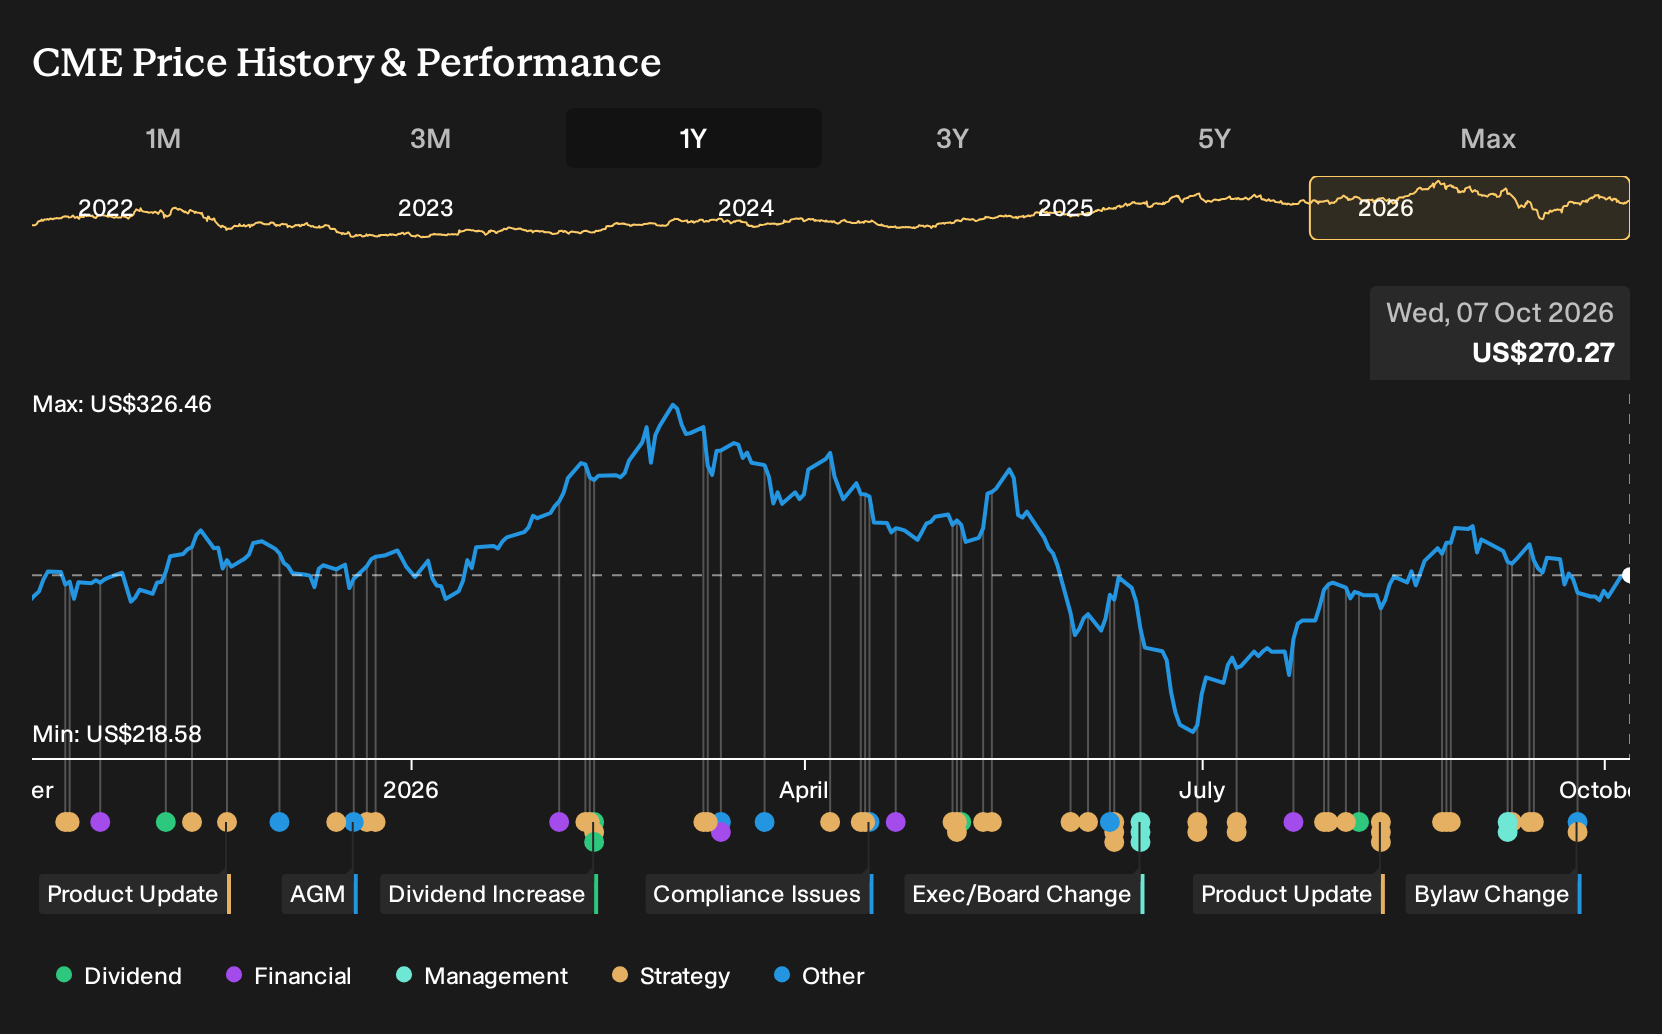
The recent elimination of the unused Series G preferred stock looks like housekeeping rather than a fundamental shift. It does not change the key debate, which is how steadily CME Group can compound fee and data revenue while funding a 4.2% dividend that is not well covered by free cash flow. If earnings growth slows or valuation expectations reset, sentiment can turn quickly.
The new agricultural futures push, including sorghum and beef contracts and the Agriculture Index, is the most relevant backdrop to rising non US volumes. It shows CME Group leaning into demand from producers and investors who want more precise hedges as input costs and weather risks preoccupy the farm economy, as highlighted by the weaker Ag Economy Barometer readings.
These launches give the exchange more levers for volume outside the crowded rate and energy arenas, which can matter if rivals chip away at share in core benchmarks. Execution risk is real. New contracts need liquidity, market maker support and adoption from both institutional and retail users before they contribute meaningfully. For a shareholder, contract uptake and open interest in these products become important micro catalysts to watch.
CME Group Forecasts And Embedded Expectations
CME Group's current analyst script ties the global derivatives story to some very specific numbers. Consensus assumes revenue will grow at 5.6% per year over the next three years, with earnings today of US$4.3b stepping up to a projected US$4.6b by 2029. That shift implies an earnings increase of about US$0.3b by the 2029 forecast year, even as profit margins are expected to ease from 63.1% to 58.2%. On the top line, the projection points to US$8.0b of revenue and US$4.6b of earnings in 2029, so any view on the stock eventually comes back to how realistic those compound growth and profitability assumptions look to you.
Uncover why CME Group's fair value indicates a 5% potential upside to its current price that may not last much longer.
Exploring Other Perspectives
Three fair value estimates from the Simply Wall St Community cluster tightly between about US$250 and US$288, yet each private investor sketches a different payoff profile for CME Group. You are weighing these views against fresh catalysts such as new agricultural contracts and the shelved 24/7 oil product, which could influence how future performance is judged. Opinions clearly span a wide spectrum, so treat this as a prompt to explore multiple viewpoints rather than settle on a single story.
Explore 2 other CME Group fair value estimates, including one that indicates up to 7% downside from the current price.
The Verdict Is Yours
Disagree with existing narratives? Extraordinary investment returns rarely come from following the herd, so go with your instincts.
- A great starting point for your CME Group research is our analysis highlighting 2 key rewards and 2 important warning signs that could impact your investment decision.
- See our latest analysis for CME Group. The report includes a comprehensive fundamental analysis summarized in a single visual, the Snowflake, making it easy to evaluate CME Group's overall financial health at a glance.
Looking For More Investment Ideas Beyond CME Group?
Once you are comfortable with how CME Group fits into your portfolio, it can help to line it up against other companies with very different drivers, risk profiles and income characteristics.
- For investors who want income to do more of the heavy lifting, review a curated set of higher yield opportunities through the 8 dividend fortresses.
- If capital preservation and balance sheet resilience matter most to you, start by scanning the 31 resilient stocks with low risk scores and focus on businesses with steadier profiles.
- For those hunting for under the radar opportunities with solid fundamentals, the 20 high quality undiscovered gems can help surface ideas that the broader market may not be paying close attention to yet.
This article by Simply Wall St is general in nature. We provide commentary based on historical data and analyst forecasts only using an unbiased methodology and our articles are not intended to be financial advice. It does not constitute a recommendation to buy or sell any stock, and does not take account of your objectives, or your financial situation. We aim to bring you long-term focused analysis driven by fundamental data. Note that our analysis may not factor in the latest price-sensitive company announcements or qualitative material. Simply Wall St has no position in any stocks mentioned.
Have feedback on this article? Concerned about the content? Get in touch with us directly. Alternatively, email editorial-team@simplywallst.com