


DexCom (DXCM) is back in focus after Citi highlighted the medtech group’s revenue growth, its raised guidance for a second straight quarter, and its expanding reach among Type 2 diabetes patients using its glucose monitoring products.
Over the past year, momentum in DexCom has been uneven. The share price return is up 26.69% year to date and 15.45% over 90 days, yet the 5 year total shareholder return is down 38.47%. As a result, recent enthusiasm around Type 2 expansion, product rollouts and community initiatives like Dexcom U comes against a mixed longer term record.
Scan beyond DexCom to identify other healthcare stocks that may have momentum and solid fundamentals, using our curated list of solid balance sheet and fundamentals (25 results) as a starting universe.
Dexcom now trades at a clear discount to both its analyst targets and intrinsic estimates after a sharp year to date rebound. Is that a genuine margin of safety, or a market warning label that fits its uneven long term record?
Most Popular Narrative: 11% Undervalued
DexCom closed at $84.30, while the most widely followed narrative pegs fair value around $94.48 using a 7.56% discount rate. That gap reflects confidence in the diabetes technology rollout and cost structure, not just near term trading momentum.
Scale manufacturing and cost discipline, including the ramp of a third high volume plant in Ireland, migration to 15 Day sensors and targeted AI productivity savings of 750,000 hours in 2025, align with DexCom’s goals for higher gross margins, rising operating margins and stronger free cash flow generation.
See why 80 investors see DexCom as 11% undervalued.
Result: Fair Value of $94.48 (UNDERVALUED)
Still, DexCom’s story could look very different if Medicare competitive bidding squeezes CGM pricing or if rivals chip away at its core Type 1 user base.
Find out about the key risks to this DexCom narrative.
Another View On DexCom’s Valuation
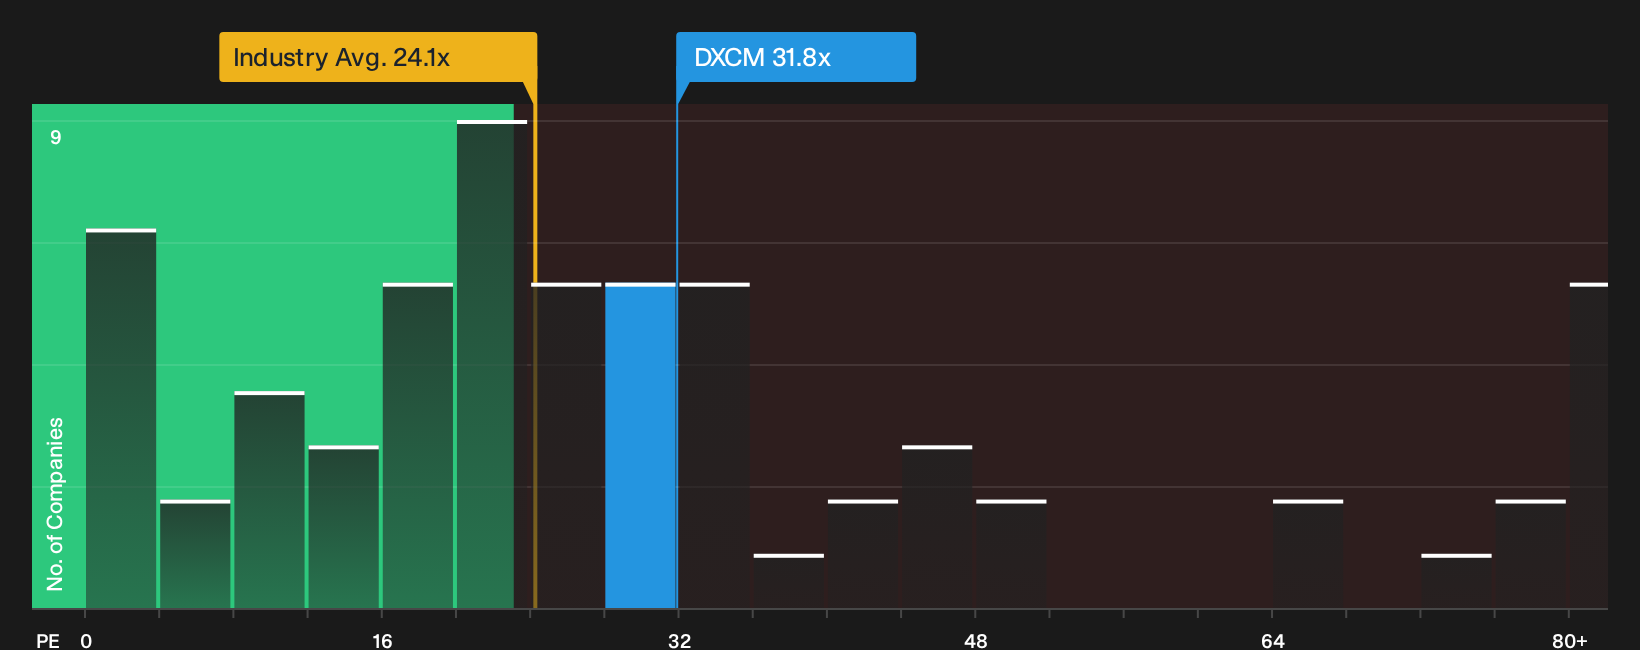
DCF and analyst narratives both lean toward DexCom looking undervalued, yet the market is still paying a rich P/E of 31.8x. That is slightly above the peer group at 30.3x and above a fair ratio of 31.3x. This raises the question of how much valuation risk you are really being paid for.
Investors who want a closer look at how this earnings multiple stacks up against peers and the fair ratio can See what the numbers say about this price — find out in our valuation breakdown.
Next Steps
Mixed messages in DexCom’s story so far. If the optimism around the rewards has you curious, review the numbers yourself and then weigh the 3 key rewards
Looking for more investment ideas beyond DexCom?
If DexCom has sharpened your focus, broaden your opportunity set with other stocks that match clear financial criteria using the Simply Wall Street Screener.
- Target potential mispricing by scanning our universe of companies that screen as attractively valued through the 29 high quality undervalued stocks.
- Prioritize resilience in tougher markets and tune into the 31 resilient stocks with low risk scores to see businesses filtered for lower overall risk profiles.
- Review the 20 high quality undiscovered gems that pair strong fundamentals with limited current attention.
This article by Simply Wall St is general in nature. We provide commentary based on historical data and analyst forecasts only using an unbiased methodology and our articles are not intended to be financial advice. It does not constitute a recommendation to buy or sell any stock, and does not take account of your objectives, or your financial situation. We aim to bring you long-term focused analysis driven by fundamental data. Note that our analysis may not factor in the latest price-sensitive company announcements or qualitative material. Simply Wall St has no position in any stocks mentioned.
Have feedback on this article? Concerned about the content? Get in touch with us directly. Alternatively, email editorial-team@simplywallst.com