


General Mills has seen its share price fall sharply in recent years, which puts fresh focus on a simple question for investors: Does the current US$32.59 price tag make sense when you line it up against the cereal giant's sales base?
- Over the past 3 years, the stock has declined 39.8%, which raises the issue of whether the market is rethinking how much it is willing to pay for General Mills' revenue stream.
- The decision to appoint Dana McNabb as CEO from 2027, alongside recent portfolio moves such as exiting the U.S. yogurt business, can reshape how future sales mix and profitability feed into what investors are prepared to pay per dollar of turnover.
- Your read on General Mills is one view; the desks covering it have another. See what analysts think General Mills's shares could be worth.
The issue now is whether today's General Mills share price is appropriately aligned with what its current and prospective sales can justify.
If you want a reference point for how other businesses are being priced on their top line, it can help to line General Mills up against 26 high quality undervalued stocks.
Does General Mills Look Fairly Valued on Sales?
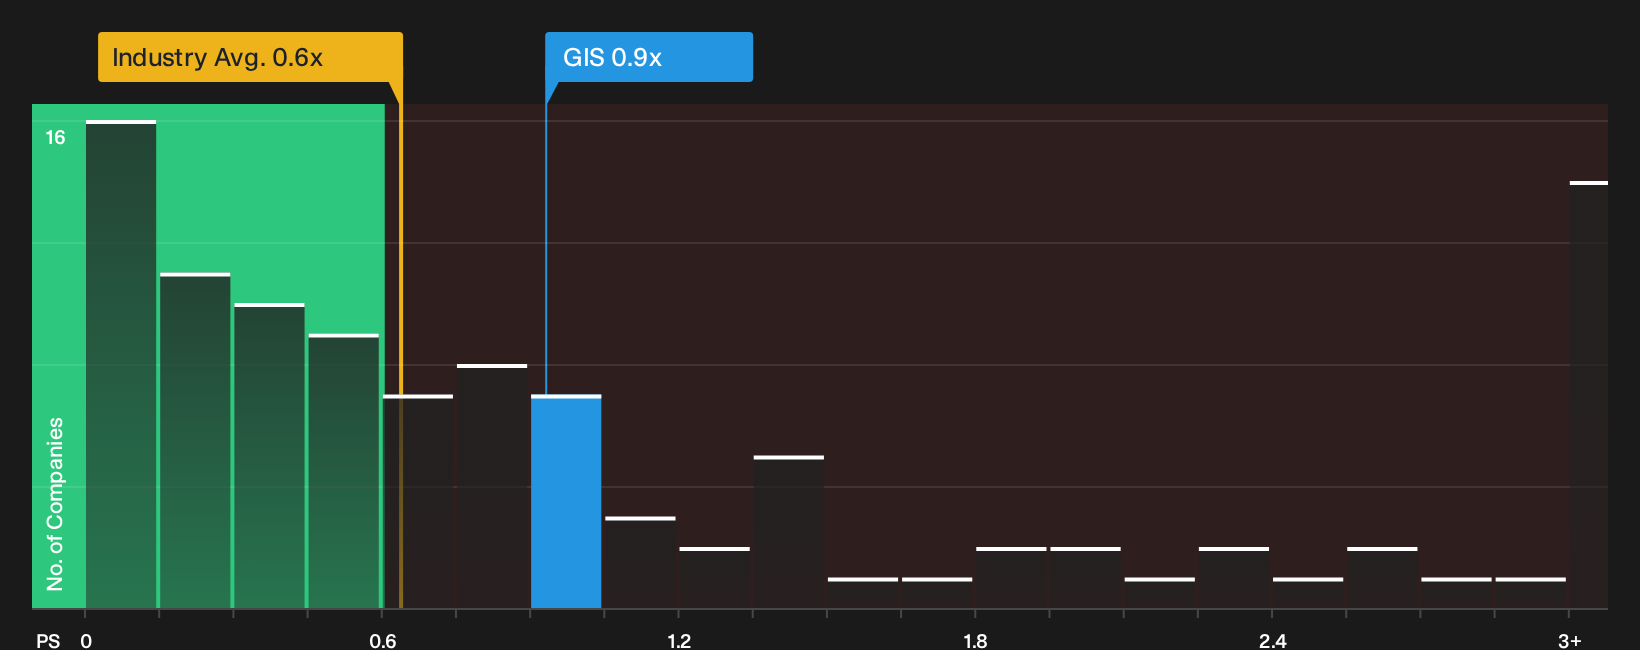
P/S fits General Mills because investors often anchor packaged food stocks to the stability and scale of their revenue rather than short term earnings swings. On that score, the shares trade on a P/S of 1.0x, a small premium to the 0.92x peer average and well ahead of the wider food industry on 0.6x. The current level also sits close to what a tailored model suggests for the business once its size, profitability profile and risk factors are taken into account.
Because the incoming CEO is set to take charge in 2027 following portfolio changes such as the U.S. yogurt exit, the fact that General Mills only trades slightly above that customised reference point suggests the market is not assigning an extreme optimism or pessimism premium to each dollar of sales. For a reader weighing the stock, this leaves the P/S multiple as a starting signal that the pricing of the revenue base is roughly in line with what the company’s fundamentals might support, rather than a clear bargain or excess. Explore the numbers behind General Mills's P/S valuation.
The General Mills Narrative: What Would Justify Today's Price?
Narratives for General Mills pick up where the valuation puzzle leaves off by spelling out which future paths for revenue, margins and earnings would need to play out for the stock to look meaningfully higher or lower than today’s price, using the Community page as their home base. Rather than stopping at a single model output or ratio, they unpack the specific future that number assumes so you can monitor over time whether reality still matches it.
Community narratives on General Mills split between one group that sees enough cost savings and portfolio reshaping to support the current tag and another that worries spending and pet expansion leave too little earnings support.
Bull case: 13% undervalued
"General Mills plans to deliver US$750 million of cost savings in fiscal 2027 as part of a US$3 billion program through fiscal 2030, which could support net margins and earnings..."
Discover why this Narrative puts General Mills at 13% undervalued.
Bear case: 9% overvalued
"The heavy emphasis on remarkability investments, including a double digit increase in media spend and higher SG&A, risks locking General Mills into structurally higher overhead..."
Explore why this Narrative puts General Mills at 9% overvalued.
One more piece of the General Mills story is easy to miss
Before you file General Mills away as fairly priced or not, it is worth checking the specific risk flags that our research has picked up and weighing how they sit with your own thesis. Take a closer look at 2 warning signs (1 major) before settling on a valuation.
This article by Simply Wall St is general in nature. We provide commentary based on historical data and analyst forecasts only using an unbiased methodology and our articles are not intended to be financial advice. It does not constitute a recommendation to buy or sell any stock, and does not take account of your objectives, or your financial situation. We aim to bring you long-term focused analysis driven by fundamental data. Note that our analysis may not factor in the latest price-sensitive company announcements or qualitative material. Simply Wall St has no position in any stocks mentioned.
Have feedback on this article? Concerned about the content? Get in touch with us directly. Alternatively, email editorial-team@simplywallst.com