


Hawkins (HWKN) has caught investor attention after recent share price moves and a wide gap between its latest close of US$127.79 and certain valuation estimates, prompting fresh questions about what the current market is pricing in.
Recent trading paints a mixed picture for Hawkins. The 1 day share price return slipped 3.47%, while the 90 day share price return is down 4.46% and the year to date share price return has declined 12.04%. Yet the longer lens looks very different, with a 3 year total shareholder return of 119.23% and a 5 year total shareholder return of 252.34%. This shows that despite recent pressure, the long term story has been rewarding for investors, and current volatility may reflect shifting expectations around growth and risk rather than a simple break in momentum.
Scan Hawkins alongside a hand picked 26 high quality undervalued stocks that share solid cash generation and balance sheet strength, yet may be priced as if recent share price weakness will last.
For Hawkins, the pullback after a strong multiyear run raises a simple fork in the road: Is this a reasonable entry today, or does patience for a steeper markdown make more sense as valuation comes into focus next?
Preferred Price-to-Earnings of 33.1x: Is it justified?
Hawkins is trading on a P/E of 33.1x, which sits against a last close of $127.79 and frames the stock as priced well above sector norms.
The P/E ratio compares what investors are paying today for each dollar of earnings. For a chemicals supplier like Hawkins, that figure often reflects expectations around the resilience of end markets, the quality of recurring demand, and the stability of cash generation rather than rapid expansion alone.
Analysts currently expect Hawkins' earnings to grow 13.44% per year, and over the past 5 years the business has grown earnings at 12.3% annually, even though the most recent year showed a decline in profit and a slip in net margin from 8.4% to 7.3%. A 33.1x multiple means the market is paying a steep premium for those earnings, which is far higher than the estimated fair P/E of 17.8x. The ratio could gravitate toward that level if sentiment cools.
Compared with the wider US Chemicals industry P/E of 22.1x and a peer average of 21.2x, Hawkins trades on a materially richer valuation, implying investors are accepting a significantly higher price than both sector and peer benchmarks for each dollar of profit.
Explore the SWS fair ratio for Hawkins.
Result: Price-to-Earnings of 33.1x (OVERVALUED)
Still, Hawkins faces clear pressure points if sentiment turns, including its recent profit decline and a premium P/E that could compress if earnings growth is lower than expected.
Find out about the key risks to this Hawkins narrative.
Another View On Hawkins Using Cash Flows
While the 33.1x P/E makes Hawkins look expensive, the SWS DCF model tells a different story. On that framework, the shares at $127.79 sit below an estimated future cash flow value of $148.36, which frames the current quotation as undervalued instead of stretched. Which signal do you trust more: earnings multiples or cash generation?
Look into how the SWS DCF model arrives at its fair value.
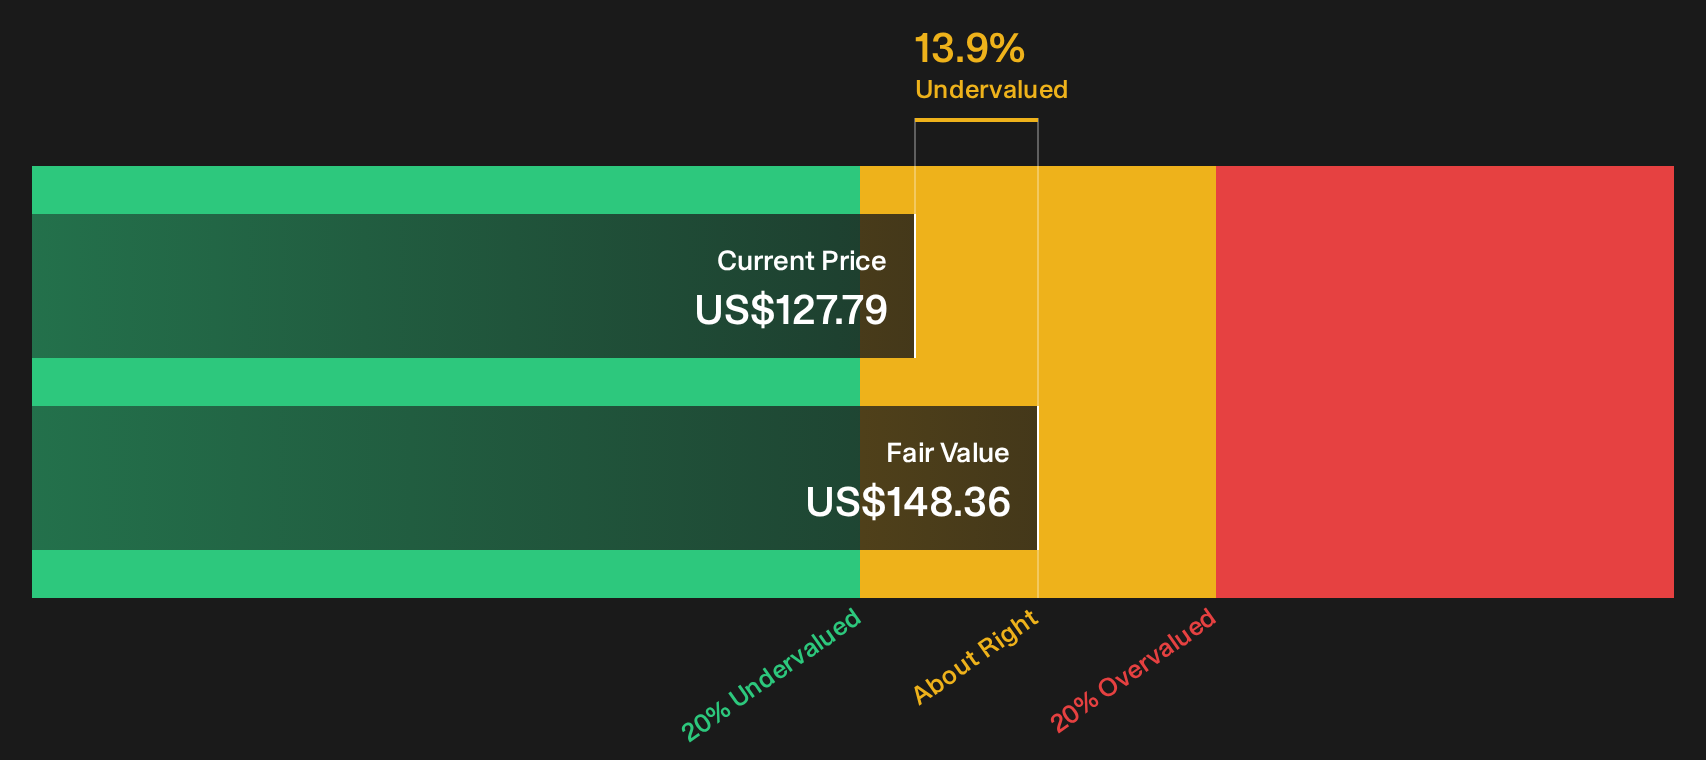
Simply Wall St performs a discounted cash flow (DCF) on every stock in the world every day (check out Hawkins for example). We show the entire calculation in full. You can track the result in your watchlist or portfolio and be alerted when this changes, or use our stock screener to discover 26 high quality undervalued stocks. If you save a screener we even alert you when new companies match - so you never miss a potential opportunity.
Next Steps
Sentiment around Hawkins is clearly split, with pressure points and bright spots pulling in opposite directions and the clock always ticking on fresh information. To weigh those cross currents on your own terms, take a close look at the 3 key rewards and 1 important warning sign.
Looking for more investment ideas beyond Hawkins?
If Hawkins has you rethinking your watchlist, now is the moment to line up a few fresh candidates before the next wave of prices moves without you.
- Target income potential by reviewing a hand picked group of higher yielding payers through the 8 dividend fortresses.
- Hunt for mispriced quality and see which businesses combine strong fundamentals with appealing entry points using the 20 high quality undiscovered gems.
- Prioritize capital preservation and check out companies with sturdier profiles via the 31 resilient stocks with low risk scores.
This article by Simply Wall St is general in nature. We provide commentary based on historical data and analyst forecasts only using an unbiased methodology and our articles are not intended to be financial advice. It does not constitute a recommendation to buy or sell any stock, and does not take account of your objectives, or your financial situation. We aim to bring you long-term focused analysis driven by fundamental data. Note that our analysis may not factor in the latest price-sensitive company announcements or qualitative material. Simply Wall St has no position in any stocks mentioned.
Have feedback on this article? Concerned about the content? Get in touch with us directly. Alternatively, email editorial-team@simplywallst.com