


Mullen Group (TSX:MTL) fell 3.65% after weakness spread across trucking stocks, as softer Canadian services activity and cooler energy sector conditions weighed on freight demand and led investors to reassess this cyclical transporter.
Zooming out, Mullen Group’s recent drop comes after a strong run, with the share price up 6.08% over 30 days and 20.03% over 90 days. A 101.81% 1-year total shareholder return points to momentum that has been building rather than fading.
Scan beyond Mullen Group and map out how other freight exposed businesses are reacting to the same macro pressures with our hand picked list of solid balance sheet and fundamentals (7 results).
Mullen Group appears to be a solid freight platform with diversified segments and positive recent returns. After this pullback and past strength, is the share price still offering a reasonable entry point for that level of quality?
Most Popular Narrative: 6% Undervalued
Mullen Group’s last close at CA$27.39 sits below a narrative fair value of CA$29, which frames the recent pullback against a modest implied upside and a detailed view on future cash generation built on an 8.07% discount rate.
Ongoing shift in revenue mix toward higher-margin, asset-light logistics and warehousing services through targeted acquisitions and strategic capital allocation is expected to structurally lift net margins and boost cash conversion, especially as recently acquired units are integrated and cost synergies realized.
See why 18 investors see Mullen Group as 6% undervalued.
Result: Fair Value of CA$29 (UNDERVALUED)
Still, the story around Mullen Group could change quickly if pricing pressure persists or acquisition heavy growth starts to squeeze profitability instead of supporting it.
Find out about the key risks to this Mullen Group narrative.
Another View On Mullen Group’s Valuation
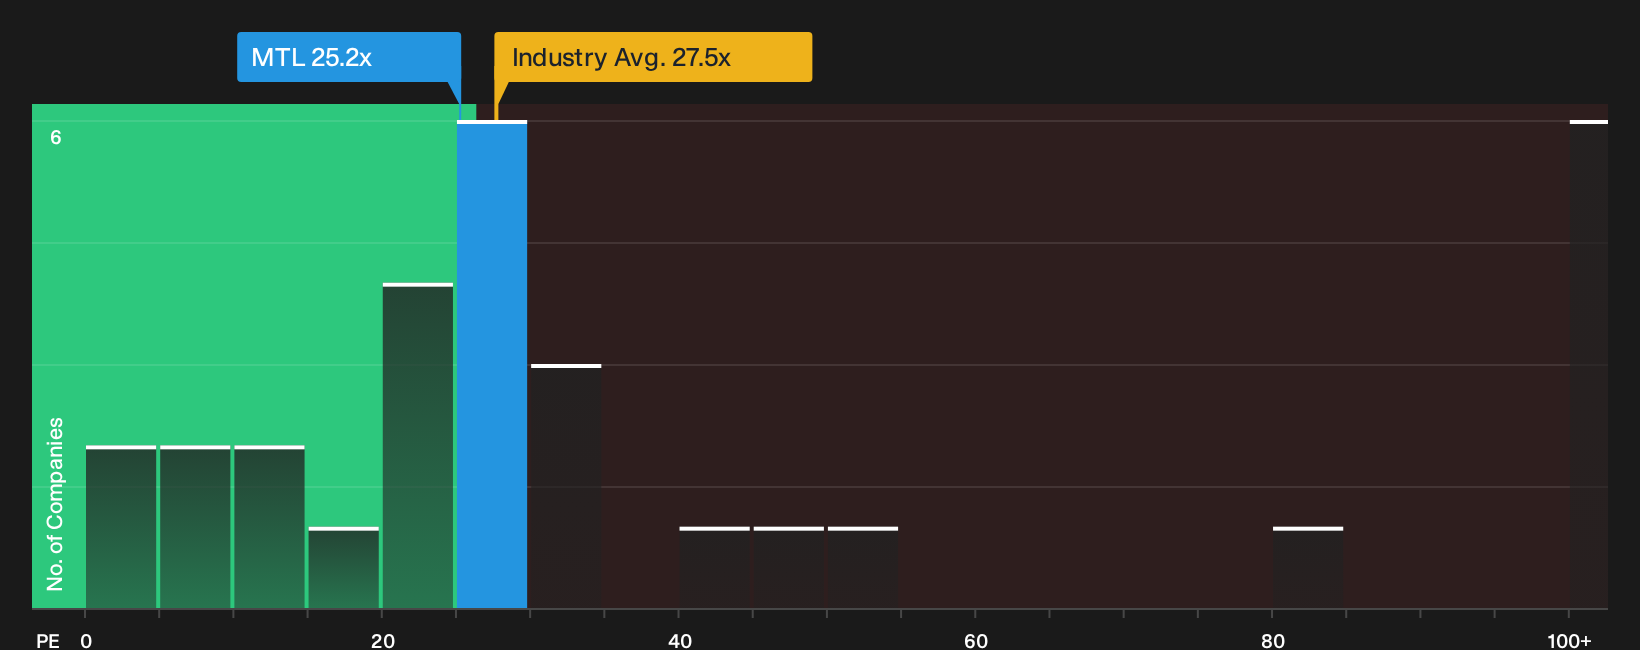
The earlier fair value of CA$29 comes from a narrative and cash flow driven view. The market is telling a different story. Mullen Group trades on a P/E of 25.2x, above its fair ratio of 20.3x and above peer levels of 22.6x, even though it sits below the broader North American Transportation average of 27.5x.
This gap suggests investors are already paying a premium to peers and to the fair ratio that the market could move toward over time. The key question is whether Mullen Group’s execution and earnings profile will keep justifying that richer tag or if the multiple has less room to stretch from here.
For a closer look at how that earnings multiple compares with fundamentals and peers, review the valuation breakdown in the See what the numbers say about this price — find out in our valuation breakdown.
Next Steps
If the mix of recent strength and valuation questions around Mullen Group feels finely balanced, consider acting promptly. Review the numbers for yourself and weigh both the upside potential and downside alerts highlighted in the 3 key rewards and 2 important warning signs.
Looking for more investment ideas beyond Mullen Group?
If Mullen Group has your attention, do not stop there. Widen your opportunity set now and give yourself more ways for your research to pay off.
- Target potential mispricing by reviewing companies flagged as high quality yet out of favor through the 7 high quality undervalued stocks.
- Strengthen your focus on resilience by scanning businesses with consistent balance sheets using the 8 resilient stocks with low risk scores.
- Pursue fresh angles by checking companies the market has not crowded into yet via the 9 high quality undiscovered gems.
This article by Simply Wall St is general in nature. We provide commentary based on historical data and analyst forecasts only using an unbiased methodology and our articles are not intended to be financial advice. It does not constitute a recommendation to buy or sell any stock, and does not take account of your objectives, or your financial situation. We aim to bring you long-term focused analysis driven by fundamental data. Note that our analysis may not factor in the latest price-sensitive company announcements or qualitative material. Simply Wall St has no position in any stocks mentioned.
Have feedback on this article? Concerned about the content? Get in touch with us directly. Alternatively, email editorial-team@simplywallst.com