


- Jefferies Financial Group reported third quarter revenue of US$3,230.8 million and net income of US$266.8 million, alongside a higher nine month revenue base and earnings, and affirmed a US$0.40 quarterly dividend while updating its share repurchase activity and authorization.
- The company is pairing fixed income issuance across multiple maturities with an expanded equity buyback plan. Together, these actions highlight simultaneous use of debt markets and shareholder return tools that investors will watch for capital structure and funding mix implications.
- Next, the focus turns to how Jefferies Financial Group's earnings profile and larger buyback authorization could shape its investment narrative.
Scan other financial stocks that pair active bond issuance with shareholder returns by focusing on our curated list of 27 high quality undervalued stocks that share similar balance sheet themes.
What Is Jefferies Financial Group's Investment Narrative?
To own Jefferies Financial Group, you need to be comfortable with a capital markets driven story where fee pools, trading activity, and underwriting volumes matter more than steady deposit funding. The recent fixed income issuances across 2030 to 2046 and the larger buyback authorization show management leaning into bond markets for funding while still sending cash to shareholders. That mix increases focus on how consistently Jefferies can produce earnings in line with its 6.9% forecast profit growth when revenue growth expectations sit closer to 0.9%.
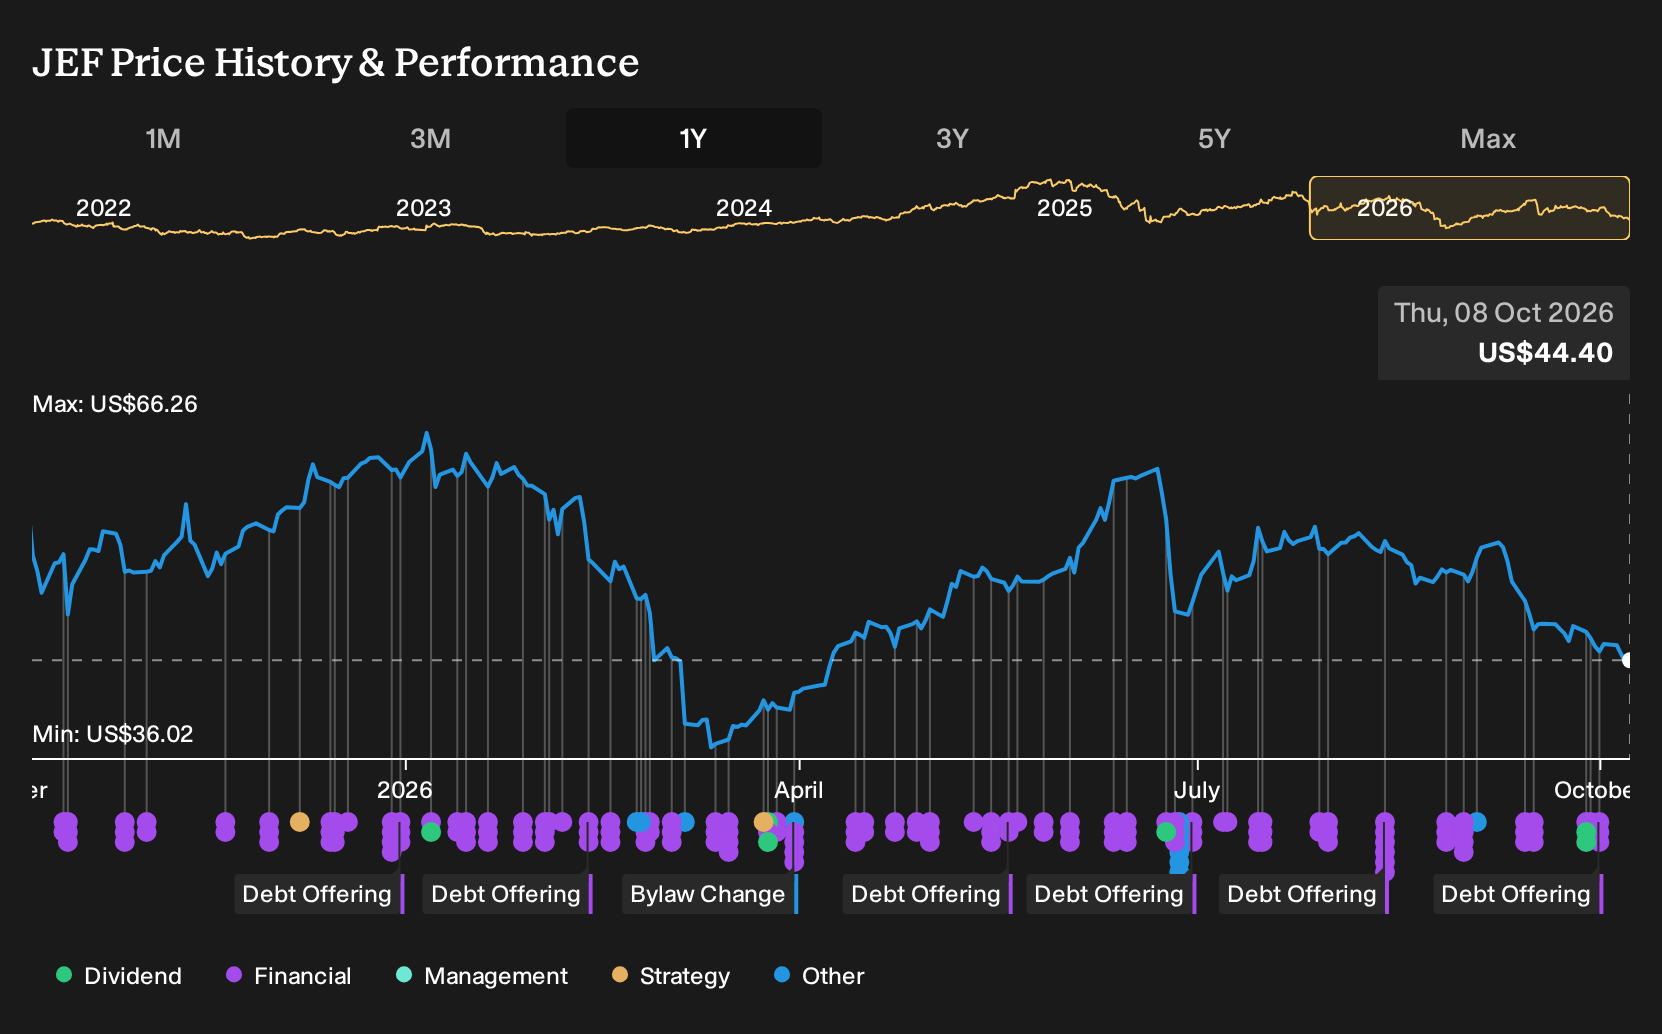
In the short term, the nearer catalyst is execution. Jefferies Financial Group just reported higher quarterly and nine month revenue and net income against the prior year, kept the US$0.40 dividend, and has been actively repurchasing stock while the share price is down 30% year to date. The upcoming Digital Assets & Tokenization Summit appearance adds an investor communication touchpoint, but the more material question is whether the firm can keep margins and trading performance resilient enough to support that debt funded, shareholder friendly playbook.
That said, all of this capital return and bond issuance sits uncomfortably next to one structural issue that could start to matter a lot if...
There's only one way to know the right time to buy, sell or hold Jefferies Financial Group. Head to Simply Wall St's company report for the latest analysis of Jefferies Financial Group's Fair Value.
Exploring Other Perspectives
Two fair value estimates from the Simply Wall St Community span roughly US$30.59 to US$55.67, so you are seeing retail investors place Jefferies Financial Group in very different valuation camps. Layer the new fixed rate bond stack and upcoming Digital Assets & Tokenization Summit into that spread, and the range of possible outcomes widens.
Explore another Jefferies Financial Group fair value estimate, including one that suggests as much as 31% downside from the current price!
Reach Your Own Conclusion
Disagree with this assessment? Extraordinary investment returns rarely come from following the herd, so go with your instincts.
- A great starting point for your Jefferies Financial Group research is our analysis highlighting 5 key rewards that could impact your investment decision.
- See our latest analysis for Jefferies Financial Group. The report includes a comprehensive fundamental analysis summarized in a single visual, the Snowflake, making it easy to evaluate Jefferies Financial Group's overall financial health at a glance.
Looking For More Investment Ideas Beyond Jefferies Financial Group?
If Jefferies Financial Group has you rethinking how much single stock exposure you want, it can help to scan a wider opportunity set and compare this business with others that match your risk and income preferences.
- For investors who want income strength with yield on top, review a curated set of potential payout candidates through 8 dividend fortresses. This may help identify ideas that could suit a cash flow focused portfolio.
- If capital preservation and steadier fundamentals sit higher on your list, filter for financially robust businesses using the list of solid balance sheet and fundamentals (25 results) to see which tickers pair lower leverage with healthier metrics.
- When the goal is to uncover potential future leaders before the crowd pays attention, cast a wider net with the 20 high quality undiscovered gems and see which underfollowed stocks share traits you already like.
This article by Simply Wall St is general in nature. We provide commentary based on historical data and analyst forecasts only using an unbiased methodology and our articles are not intended to be financial advice. It does not constitute a recommendation to buy or sell any stock, and does not take account of your objectives, or your financial situation. We aim to bring you long-term focused analysis driven by fundamental data. Note that our analysis may not factor in the latest price-sensitive company announcements or qualitative material. Simply Wall St has no position in any stocks mentioned.
Have feedback on this article? Concerned about the content? Get in touch with us directly. Alternatively, email editorial-team@simplywallst.com