


Triple Flag Precious Metals (TSX:TFPM) just posted preliminary third quarter 2026 revenue of US$106.7 million, generated from 25,030 gold equivalent ounces, after receiving its first deliveries from the Ravenswood mine in Australia.
Triple Flag Precious Metals shares trade at CA$43.55 after a 9.45% 90 day share price return, even though the 30 day share price performance is down 6.53%, and the 5 year total shareholder return above 3x indicates that momentum has been building over the longer term.
Scan other precious metals opportunities that are moving on similar themes of project ramp ups and operational momentum through our curated list of 35 elite gold producer stocks.
Bulls will point to Triple Flag Precious Metals’ new Ravenswood contribution and long run shareholder gains, while bears focus on softer earnings growth and a recent pullback. Which case does the current valuation actually support?
Most Popular Narrative: 27% Undervalued
Triple Flag Precious Metals last closed at CA$43.55, while the most followed narrative pegs fair value closer to CA$59.34, so the gap between price and narrative valuation is wide enough that investors are asking what really underpins that number.
Multiple new royalty and streaming investments including the Arthur Gold project in Nevada, Arcata and Azuca silver mines in Peru, and Johnson Camp copper mine in Arizona are expected to deliver first revenues in the second half of 2025, underpinning forward growth in revenue and operating cash flow as these assets ramp up. Embedded exploration and reserve expansion optionality at key assets, such as the resource doubling at Beta Hunt (Fletcher Zone) and continued exploration upside at Arthur and Northparkes, could drive volume growth and prolong cash flow generation, positively impacting both revenue and free cash flow in the medium to long term.
See why 21 investors see Triple Flag Precious Metals as 27% undervalued.
Result: Fair Value of CA$59.34 (UNDERVALUED)
Still, the bullish Triple Flag Precious Metals story can be challenged if output at key underlying mines fades faster than expected, or if commodity prices reset lower for longer.
Find out about the key risks to this Triple Flag Precious Metals narrative.
Another View: What Multiples Say About Triple Flag Precious Metals
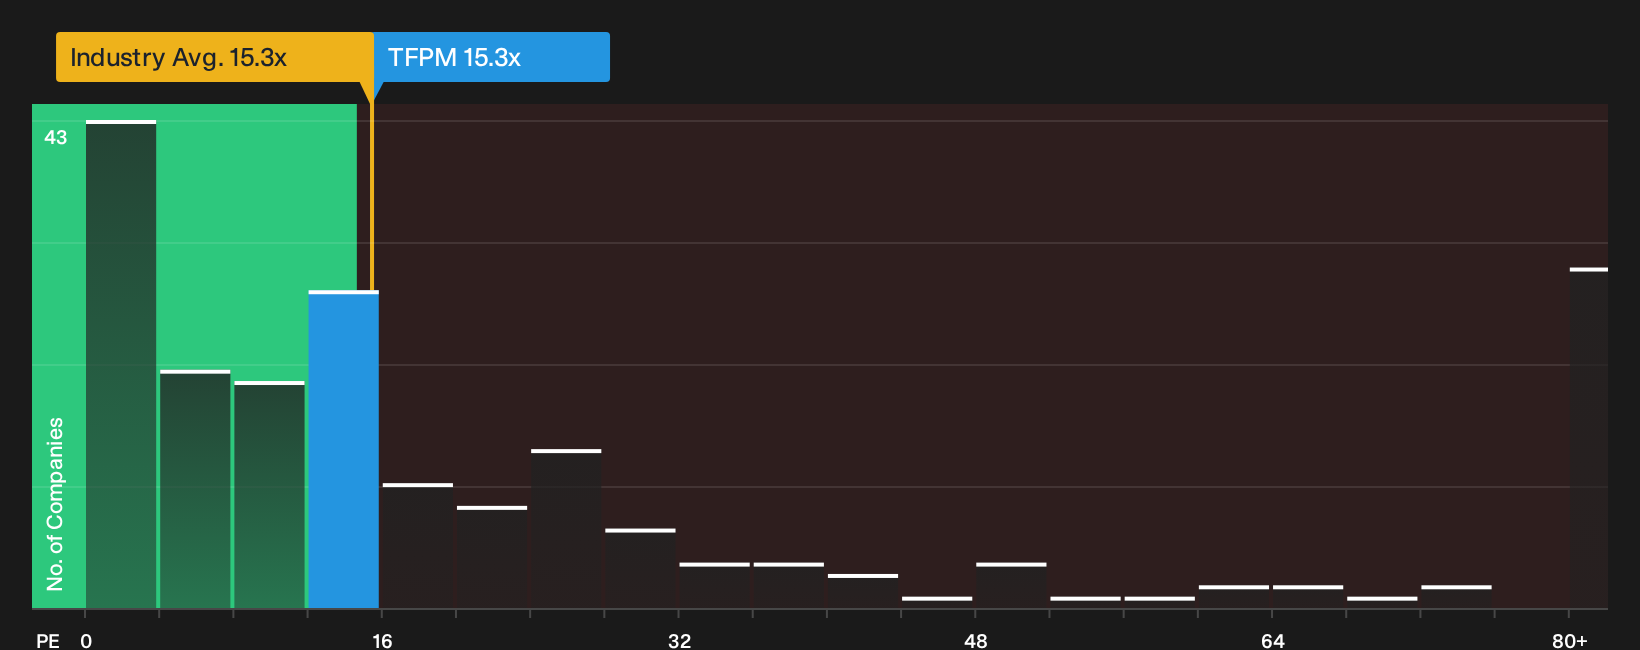
The story looks different once price ratios are brought into the picture. Triple Flag Precious Metals trades on a P/E of 15.3x, slightly above the Canadian Metals and Mining average of 15.2x and well above its own fair ratio of 11.8x. That gap points to less of a bargain and more valuation risk if sentiment cools.
For anyone weighing this against the earlier fair value figures, it helps to see how the current P/E compares visually and where the fair ratio sits as a potential anchor point for the market, which you can review in our valuation breakdown, See what the numbers say about this price — find out in our valuation breakdown.
Next Steps
Mixed signals have run through this Triple Flag Precious Metals story, so if you want to move quickly and shape your own view, weigh both the downside alerts and the upside potential in the 4 key rewards and 3 important warning signs.
Looking for more investment ideas beyond Triple Flag Precious Metals?
If Triple Flag Precious Metals has caught your attention, do not stop here. Broader idea hunting gives you context, options, and better odds of spotting mispriced opportunities.
- Target quality at a discount by scanning our 7 high quality undervalued stocks and compare those candidates against what you see in Triple Flag Precious Metals.
- Build a steadier income stream by reviewing the 3 dividend fortresses that pair higher yields with fundamental support instead of chasing payouts in isolation.
- Reduce portfolio stress by focusing on resilience first, using the 8 resilient stocks with low risk scores to highlight businesses with stronger balance sheets and lower overall risk scores.
This article by Simply Wall St is general in nature. We provide commentary based on historical data and analyst forecasts only using an unbiased methodology and our articles are not intended to be financial advice. It does not constitute a recommendation to buy or sell any stock, and does not take account of your objectives, or your financial situation. We aim to bring you long-term focused analysis driven by fundamental data. Note that our analysis may not factor in the latest price-sensitive company announcements or qualitative material. Simply Wall St has no position in any stocks mentioned.
Have feedback on this article? Concerned about the content? Get in touch with us directly. Alternatively, email editorial-team@simplywallst.com