


Broadcom has ridden the AI infrastructure buildout to very large gains over the past few years, and the latest wave of chip financing deals now puts a sharper spotlight on one question for investors: how much of today’s share price is actually supported by the company’s cash flows.
- Over the past 5 years the stock has returned about 7x. This raises the stakes for whether that kind of share price climb is grounded in cash generation or in expectations that may prove harder to sustain.
- Broadcom’s role arranging more than $50b in debt financing for custom AI chips and its multi year commitments with AI customers can support substantial future cash inflows, but can also concentrate cash flow on a few large counterparties and extend the payback period on heavy capital needs.
- What if you looked at Broadcom through its earnings instead? See what Broadcom's 44.9x P/E says about the price.
The issue now is whether Broadcom’s current market value is justified by the cash flows that its AI chip and networking business can realistically produce over time.
If you are weighing Broadcom’s AI cash flow story, it can help to compare it with other AI infrastructure plays using 91 AI infrastructure stocks.
Does Broadcom Look Undervalued on Cash Flow?
The Discounted Cash Flow (DCF) model here is built on Broadcom’s projected free cash generation rather than near term earnings multiples. Over the last twelve months Broadcom produced about $39.6b of free cash flow, which already gives the business a sizeable cash engine before layering in any AI uplift.
The long range forecast in this DCF assumes growing free cash flow, with projected annual cash generation rising well above current levels by the early 2030s. That kind of curve only makes sense if Broadcom keeps turning heavyweight AI chip and networking contracts into sustained, repeatable cash, not just one off financing headlines. Because the recent push to arrange more than $50b of debt for OpenAI’s custom chips increases both opportunity and risk concentration with a few customers, the market price of $360.14 can reasonably lag what the cash flow model supports. Find out what Broadcom could be worth using our Discounted Cash Flow (DCF) estimate.
The Broadcom Narrative: What Would Justify Today's Price?
Simply Wall St Narratives pick up where the Broadcom valuation puzzle leaves off by spelling out which paths for revenue growth, profitability and earnings would need to play out for the share price to sit meaningfully above or below where it trades today, and they sit on Simply Wall St's Community page. Rather than relying on a single ratio or one DCF output, each Narrative lays out its own set of conditions for fair value so you can compare those assumptions with Broadcom's reported results over time.
Community views on Broadcom split between those who see a durable digital infrastructure cash engine and those who think expectations already run too hot.
Bull case: 45% undervalued
"Broadcom has spent decades positioning itself at critical points within the technology stack where performance, reliability, and scale matter most..."
Discover why this Narrative puts Broadcom at 45% undervalued.
Bear case: 39% overvalued
"Broadcom demonstrates exceptional business metrics, presenting high growth, high margins a wide moat and in a promising industry..."
Explore why this Narrative puts Broadcom at 39% overvalued.
One more Broadcom signal worth checking before you move on
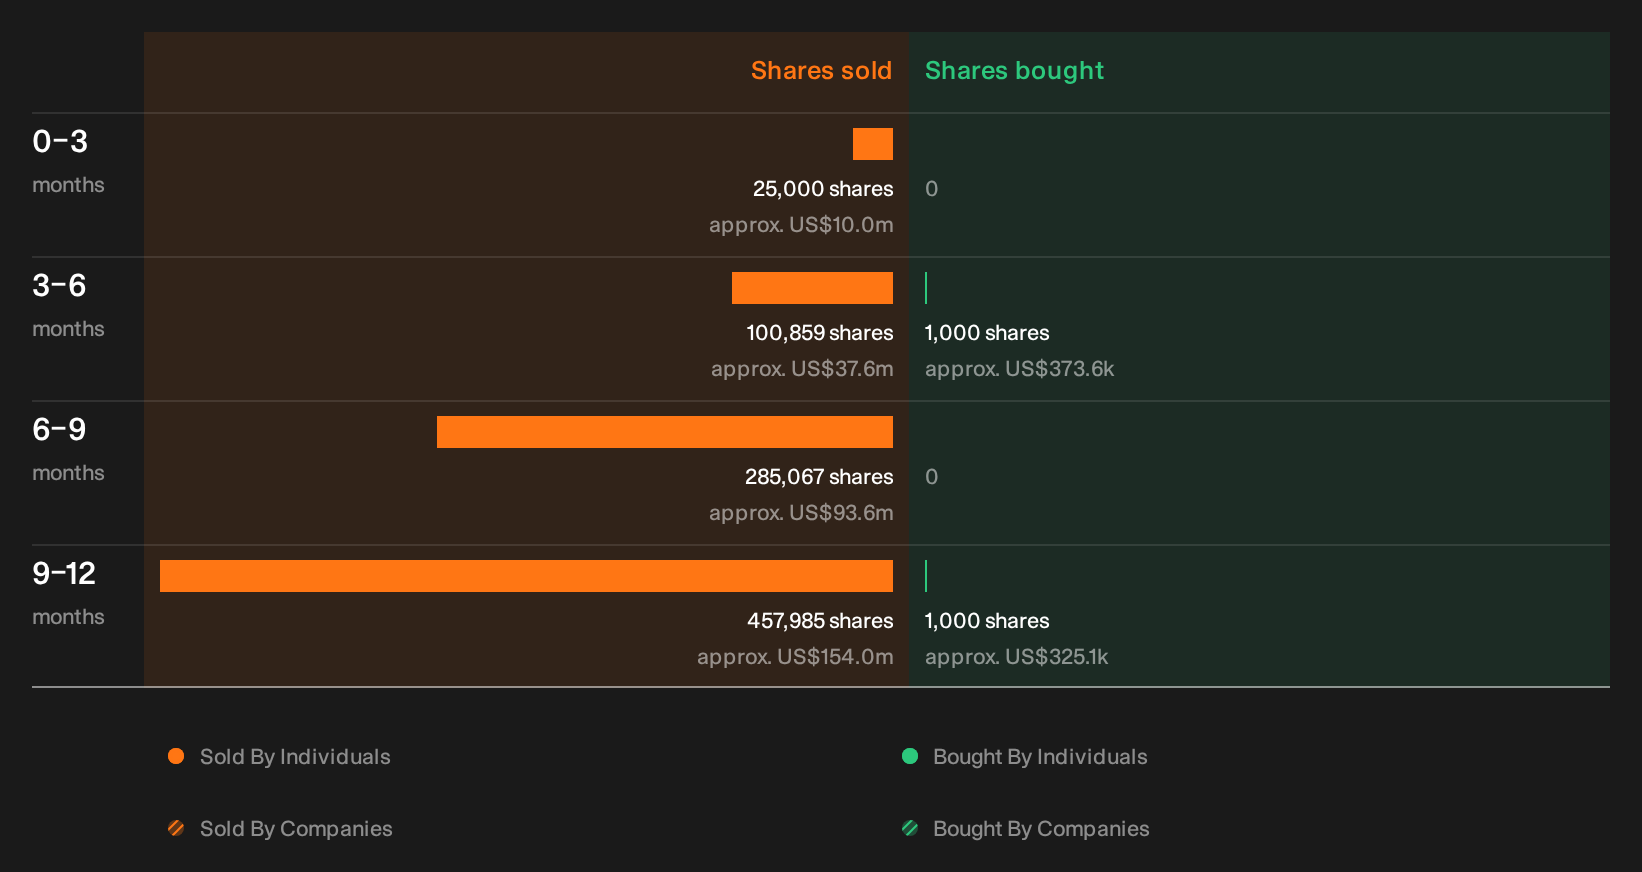
Valuation is only part of the picture, and recent trading by Broadcom insiders adds another layer that our checks have picked up but not unpacked in detail. See the recent insider selling flagged for Broadcom.
This article by Simply Wall St is general in nature. We provide commentary based on historical data and analyst forecasts only using an unbiased methodology and our articles are not intended to be financial advice. It does not constitute a recommendation to buy or sell any stock, and does not take account of your objectives, or your financial situation. We aim to bring you long-term focused analysis driven by fundamental data. Note that our analysis may not factor in the latest price-sensitive company announcements or qualitative material. Simply Wall St has no position in any stocks mentioned.
Have feedback on this article? Concerned about the content? Get in touch with us directly. Alternatively, email editorial-team@simplywallst.com