


The Canadian market has been navigating a complex landscape of rising interest rates and a resilient economy, with long-term bond yields reaching multidecade highs. Despite these challenges, robust corporate profit growth and investment in sectors like artificial intelligence have helped maintain market stability. In this environment, identifying undervalued stocks can be particularly rewarding for investors seeking opportunities that are trading below their intrinsic value. Understanding key economic indicators and company fundamentals is essential when evaluating such potential investments on the TSX.
Top 10 Undervalued Stocks Based On Cash Flows In Canada
| Name | Current Price | Fair Value (Est) | Discount (Est) |
| Suncor Energy (TSX:SU) | CA$100.89 | CA$190.48 | 47% |
| Stantec (TSX:STN) | CA$96.42 | CA$151.81 | 36.5% |
| Savaria (TSX:SIS) | CA$28.81 | CA$49.75 | 42.1% |
| Pan American Silver (TSX:PAAS) | CA$64.38 | CA$128.22 | 49.8% |
| OceanaGold (TSX:OGC) | CA$37.92 | CA$68.01 | 44.2% |
| Linamar (TSX:LNR) | CA$94.52 | CA$188.76 | 49.9% |
| Hudbay Minerals (TSX:HBM) | CA$36.09 | CA$69.05 | 47.7% |
| Groupe Dynamite (TSX:GRGD) | CA$54.12 | CA$106.56 | 49.2% |
| Chemtrade Logistics Income Fund (TSX:CHE.UN) | CA$14.39 | CA$28.10 | 48.8% |
| Canadian Natural Resources (TSX:CNQ) | CA$69.84 | CA$129.50 | 46.1% |
Below we spotlight a couple of our favorites from our exclusive screener.
Linamar (TSX:LNR)
Overview: Linamar Corporation, with a market cap of CA$5.70 billion, manufactures and sells engineered products across Canada, Europe, the Asia Pacific, and the rest of North America.
Operations: The company's revenue is primarily derived from two segments: Mobility, generating CA$8.54 billion, and Industrial, contributing CA$2.65 billion.
Estimated Discount To Fair Value: 49.9%
Linamar's current valuation appears attractive, trading at CA$94.52, significantly below its estimated future cash flow value of CA$188.76 and 49.9% under fair value estimates. Despite substantial insider selling recently, the company has demonstrated strong financial performance with second-quarter sales reaching CA$3.14 billion and net income at CA$183.1 million, both up from the previous year. Revenue is expected to grow faster than the Canadian market at 5.7% annually.
- According our earnings growth report, there's an indication that Linamar might be ready to expand.
- Navigate through the intricacies of Linamar with our comprehensive financial health report here.
OceanaGold (TSX:OGC)
Overview: OceanaGold Corporation is involved in the exploration, development, and operation of gold and gold/copper mines across the United States, the Philippines, and New Zealand with a market capitalization of approximately CA$8.38 billion.
Operations: The company's revenue is derived from its mining operations at Haile ($795.80 million), Waihi ($337.80 million), Didipio ($548.60 million), and Macraes ($780.50 million).
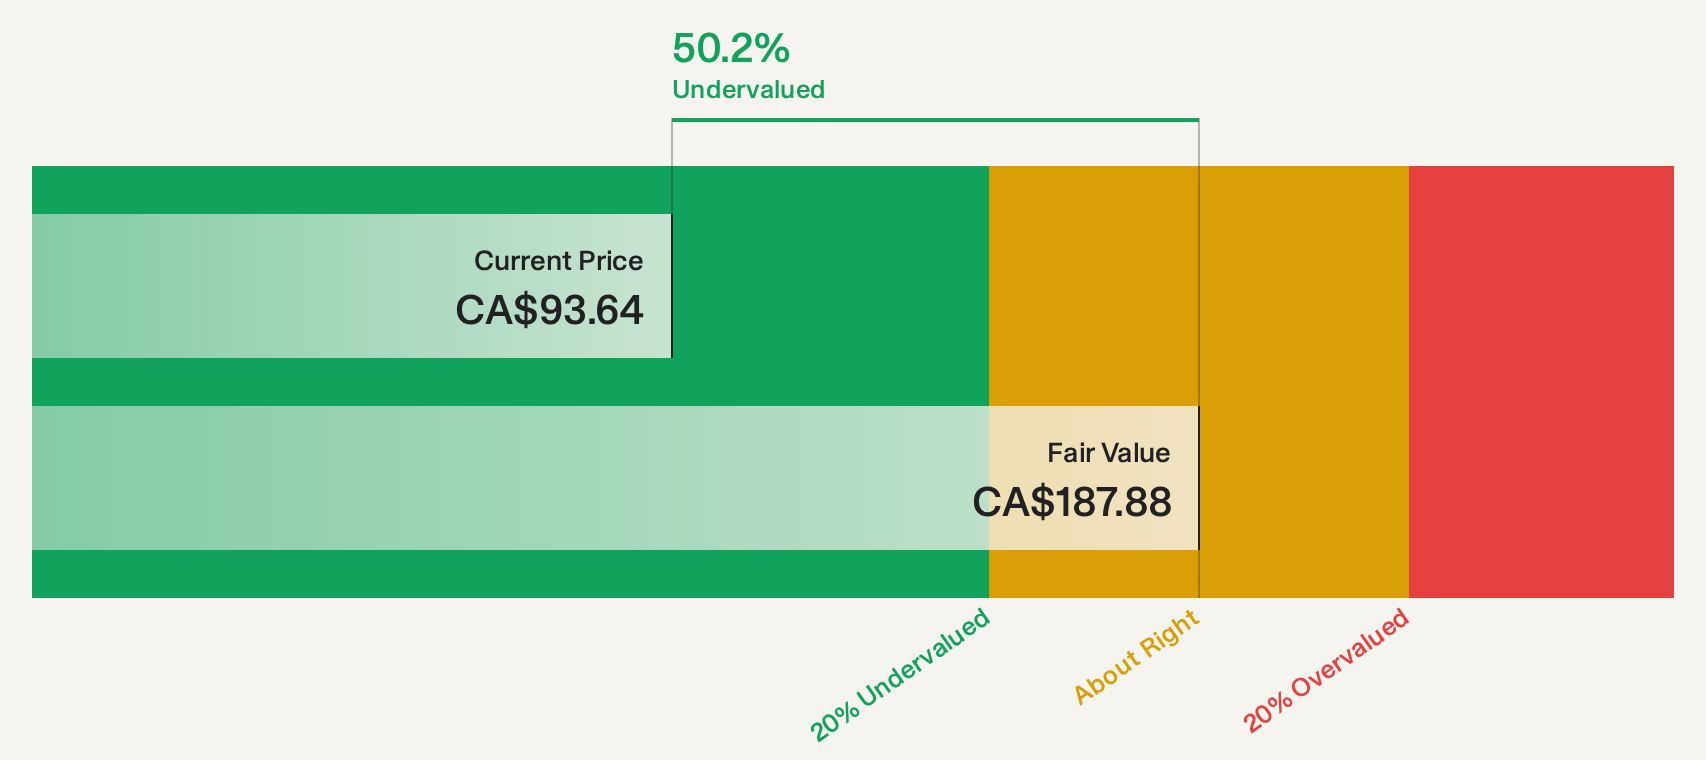
Estimated Discount To Fair Value: 44.2%
OceanaGold is trading at CA$37.92, significantly below its estimated future cash flow value of CA$68.01, marking it as highly undervalued based on discounted cash flows. The company has shown robust earnings growth of 130.3% over the past year and forecasts an annual profit increase of 14.6%, outpacing the Canadian market's 11.7%. Recent exploration successes in New Zealand and strategic expansions in the Philippines further bolster its potential for enhancing resource reserves and operational longevity.
- Our comprehensive growth report raises the possibility that OceanaGold is poised for substantial financial growth.
- Take a closer look at OceanaGold's balance sheet health here in our report.

Suncor Energy (TSX:SU)
Overview: Suncor Energy Inc. is an integrated energy company operating in Canada, the United States, and internationally with a market cap of CA$113.76 billion.
Operations: The company generates revenue through its Oil Sands segment (CA$26.87 billion), Refining and Marketing segment (CA$36.75 billion), and Exploration and Production segment (CA$2.50 billion).
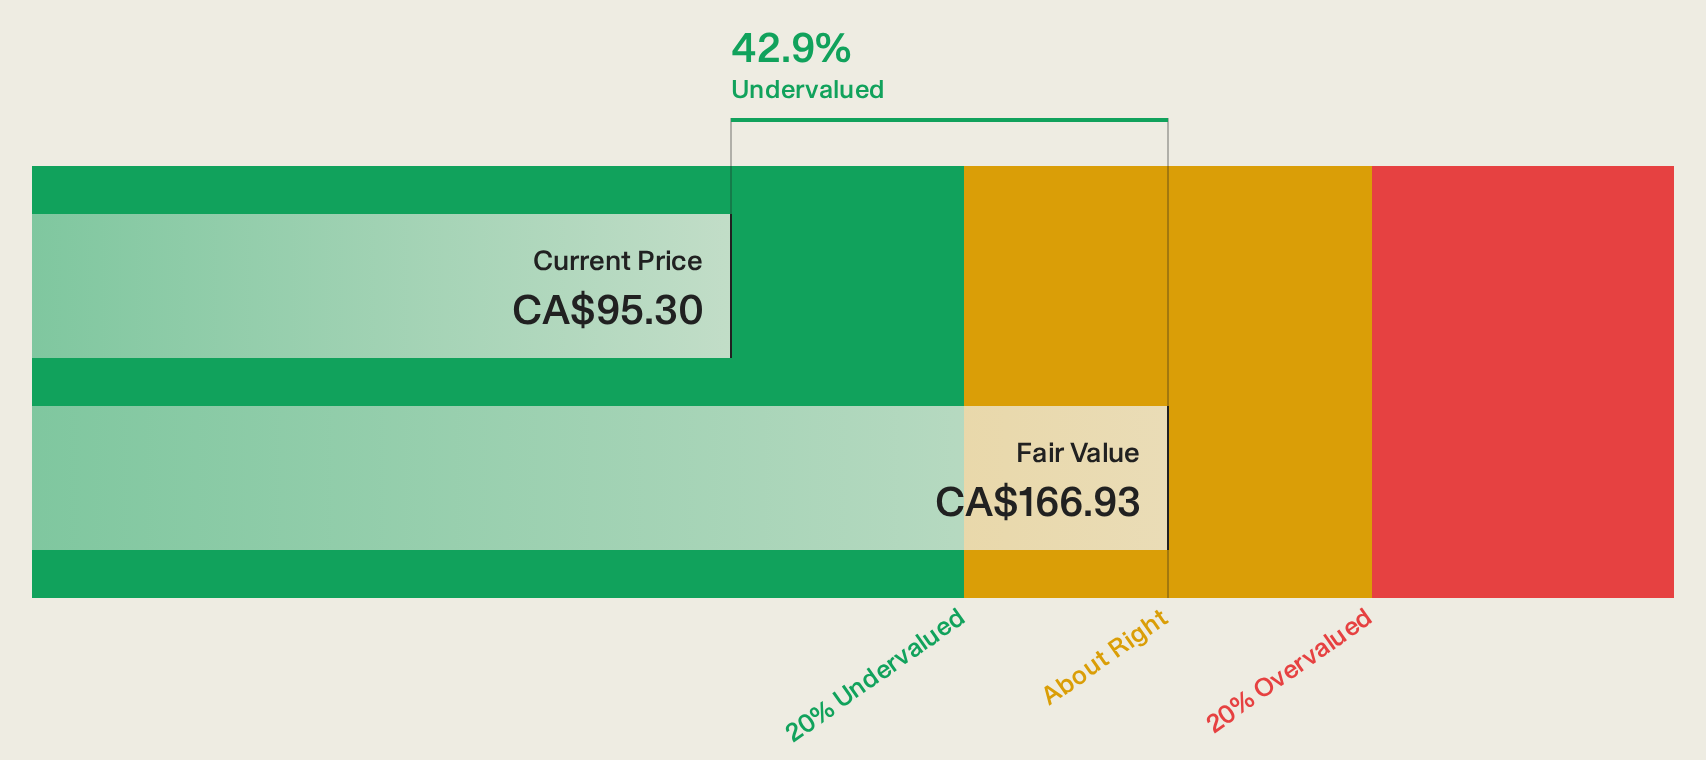
Estimated Discount To Fair Value: 47%
Suncor Energy trades at CA$100.89, substantially below its future cash flow value of CA$190.48, indicating significant undervaluation. Despite a 57.7% earnings increase over the past year, forecasts suggest revenue and earnings will decline annually by 3.2% and 9.6%, respectively, over the next three years. Recent strategic alliances in carbon capture may offer long-term potential, but current financial projections highlight challenges ahead despite robust cash flow valuation metrics.
- Our earnings growth report unveils the potential for significant increases in Suncor Energy's future results.
- Get an in-depth perspective on Suncor Energy's balance sheet by reading our health report here.
Turning Ideas Into Actions
- Discover the full array of 12 Undervalued TSX Stocks Based On Cash Flows right here.
- Invested in any of these stocks? Simplify your portfolio management with Simply Wall St and stay ahead with our alerts for any critical updates on your stocks.
- Join a community of smart investors by using Simply Wall St. It's free and delivers expert-level analysis on worldwide markets.
Contemplating Other Strategies?
- Explore high-performing small cap companies that haven't yet garnered significant analyst attention.
- Diversify your portfolio with solid dividend payers offering reliable income streams to weather potential market turbulence.
- Fuel your portfolio with companies showing strong growth potential, backed by optimistic outlooks both from analysts and management.
This article by Simply Wall St is general in nature. We provide commentary based on historical data and analyst forecasts only using an unbiased methodology and our articles are not intended to be financial advice. It does not constitute a recommendation to buy or sell any stock, and does not take account of your objectives, or your financial situation. We aim to bring you long-term focused analysis driven by fundamental data. Note that our analysis may not factor in the latest price-sensitive company announcements or qualitative material. Simply Wall St has no position in any stocks mentioned.
Have feedback on this article? Concerned about the content? Get in touch with us directly. Alternatively, email editorial-team@simplywallst.com