


Aliaxis (ENXTBR:094124352) has drawn fresh attention after recent price action left the stock trading at €17. That level sits against a mixed return profile, including a decline over the past month and a fall over the past year.
Recent performance has been choppy for Aliaxis, with the share price down 5.56% over the past month but up 4.94% over the last quarter. Longer term total shareholder return over three and five years has declined 46.88% and 33.51% respectively, pointing to fading momentum overall as investors reassess both risk and valuation.
Compare Aliaxis's recent pullback with other potential rebuilding stories by scanning our hand picked 618 high quality undiscovered gems that also pair strong fundamentals with weaker share price trends.
After that slide and bounce, Aliaxis now trades at €17 while modelled intrinsic value data points to a slight premium. Is the recent weakness already more than reflected in the price, or not yet?
Price-to-Earnings of 59.4x: Is it justified?
Aliaxis trades at €17 while sitting on a P/E ratio of 59.4x, which places the stock on a far richer earnings multiple than many peers.
The P/E ratio shows how much investors are paying for each euro of profit. For a pipes and fittings manufacturer operating across sectors like building, infrastructure, and agriculture, this measure helps you gauge how the market is pricing its profitability relative to other listed industrial groups.
With earnings having declined by 40.2% per year over the past 5 years, a 59.4x P/E suggests buyers are accepting a high price relative to recent profit performance. That leaves little room in the current valuation for disappointments or further weakness in profitability based on the data available.
The premium becomes even starker against benchmarks. Aliaxis carries a P/E of 59.4x compared with 24.2x for the wider European Building industry and 26.3x for direct peers, which is a very strong mark up versus both groupings.
See what the numbers say about this price — find out in our valuation breakdown.
Result: Price-to-Earnings of 59.4x
Still, the current valuation story for Aliaxis could be challenged if earnings stay weak or if sentiment toward higher multiple industrial stocks cools further.
Find out about the key risks to this Aliaxis narrative.
Another view on Aliaxis using the SWS DCF model
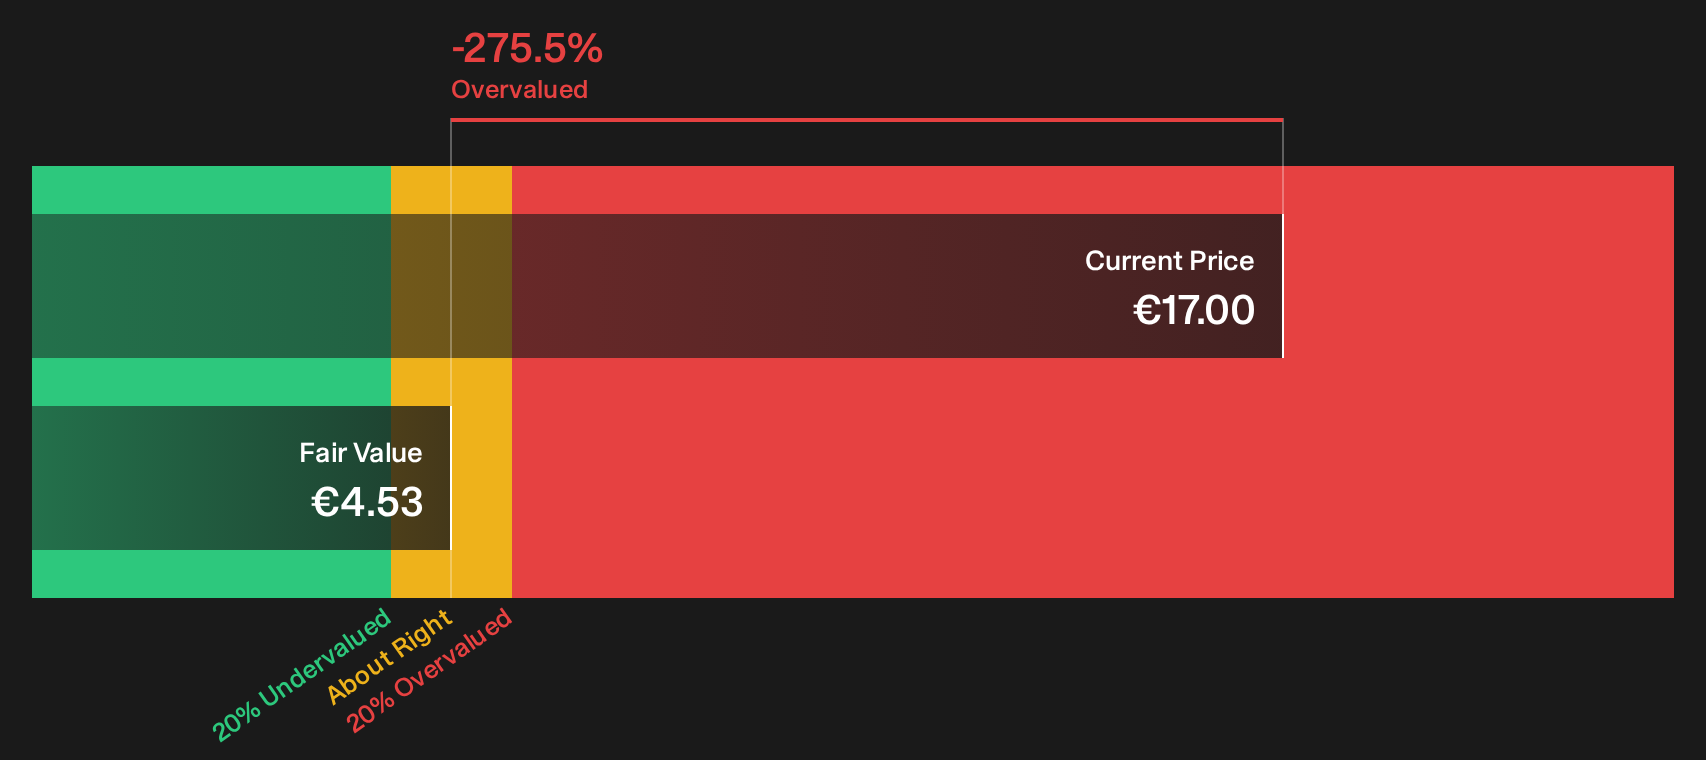
The earlier P/E discussion presented Aliaxis as richly priced against earnings. A different lens suggests an even wider gap. Our DCF model estimates future cash flow value at €4.53 per share, while the stock trades at €17, which means the market price sits far above that modelled value.
That kind of difference can reflect optimism about future cash generation or a mismatch between expectations and the current cash flow profile. If the SWS DCF model is closer to reality than the headline multiple, the question is how comfortable you are paying this kind of premium for Aliaxis today.
Look into how the SWS DCF model arrives at its fair value.
Simply Wall St performs a discounted cash flow (DCF) on every stock in the world every day (check out Aliaxis for example). We show the entire calculation in full. You can track the result in your watchlist or portfolio and be alerted when this changes, or use our stock screener to discover 172 high quality undervalued stocks. If you save a screener we even alert you when new companies match - so you never miss a potential opportunity.
Next Steps
Mixed signals on Aliaxis so far. If you want to move quickly and ground your own view in the data, start by weighing its 1 key reward and 3 important warning signs.
Looking for more investment ideas beyond Aliaxis?
If Aliaxis has sparked questions about value, returns, and risk, you can use that curiosity to sharpen your watchlist and upgrade the quality of ideas you act on next.
- Explore potential mispricing and look for quality at a reasonable price with our hand picked 172 high quality undervalued stocks tailored to businesses that combine fundamentals with appealing entry points.
- Prioritise resilience and focus on peace of mind by using a 222 resilient stocks with low risk scores that filters for sturdier balance sheets and steadier risk profiles.
- Consider income potential alongside capital moves by scanning a curated set of 221 dividend fortresses designed for investors who want yields with staying power.
This article by Simply Wall St is general in nature. We provide commentary based on historical data and analyst forecasts only using an unbiased methodology and our articles are not intended to be financial advice. It does not constitute a recommendation to buy or sell any stock, and does not take account of your objectives, or your financial situation. We aim to bring you long-term focused analysis driven by fundamental data. Note that our analysis may not factor in the latest price-sensitive company announcements or qualitative material. Simply Wall St has no position in any stocks mentioned.
Have feedback on this article? Concerned about the content? Get in touch with us directly. Alternatively, email editorial-team@simplywallst.com