


China's agreement with the European Union to curb hybrid vehicle exports and maintain rare earth supplies is rippling across auto related businesses. CAR Group (ASX:CAR) sits squarely in that global vehicle trading flow.
Recent trading has been choppy for CAR Group, with the share price at A$22.8 after a 1-day share price return of 1.74% and a 7-day gain of 1.92%. However, the 30-day share price return is down 8.54% and the year-to-date share price return is down 26.14%, leaving the 1-year total shareholder return down 35.99% and pointing to fading momentum even as China and the EU try to stabilise auto trade flows and rare earth supply.
Scan beyond CAR Group and see how other auto exposed platforms and marketplaces are positioned around trade policy shifts with our 15 high quality undiscovered gems.
After a near 36% slide in the past year, CAR Group now sits well below analyst targets and its recent peak. Is the meaningful upside still ahead, or was that already spent on the last cycle up?
Most Popular Narrative: 29% Undervalued
On the most followed view, CAR Group is worth A$32.0 a share compared with the latest A$22.8 close, which puts a lot of weight on the cash generation and resilience implied in that narrative.
CAR Group operates dominant two-sided online vehicle marketplaces carsales (Australia, approximately 9x the engagement of its nearest rival), Encar (Korea), webmotors (Brazil), Trader Interactive (US non-auto) and chileautos, with approximately 85% gross and approximately 46% EBITDA margins and free-cash conversion above 95% of EBITDA. It is a genuine franchise, the Quality Gate and Truth Tests pass, predictability is High, and per-share free cash flow has compounded approximately 14% a year despite heavy acquisition dilution.
See why 7 investors see CAR Group as 29% undervalued.
Result: Fair Value of A$32.0 (UNDERVALUED)
Still, the CAR Group narrative could be derailed if AI tools pull car buyers away from its marketplaces, or if the Trader Interactive acquisition suffers a sharp earnings reset.
Find out about the key risks to this CAR Group narrative.
Another View On CAR Group’s Valuation
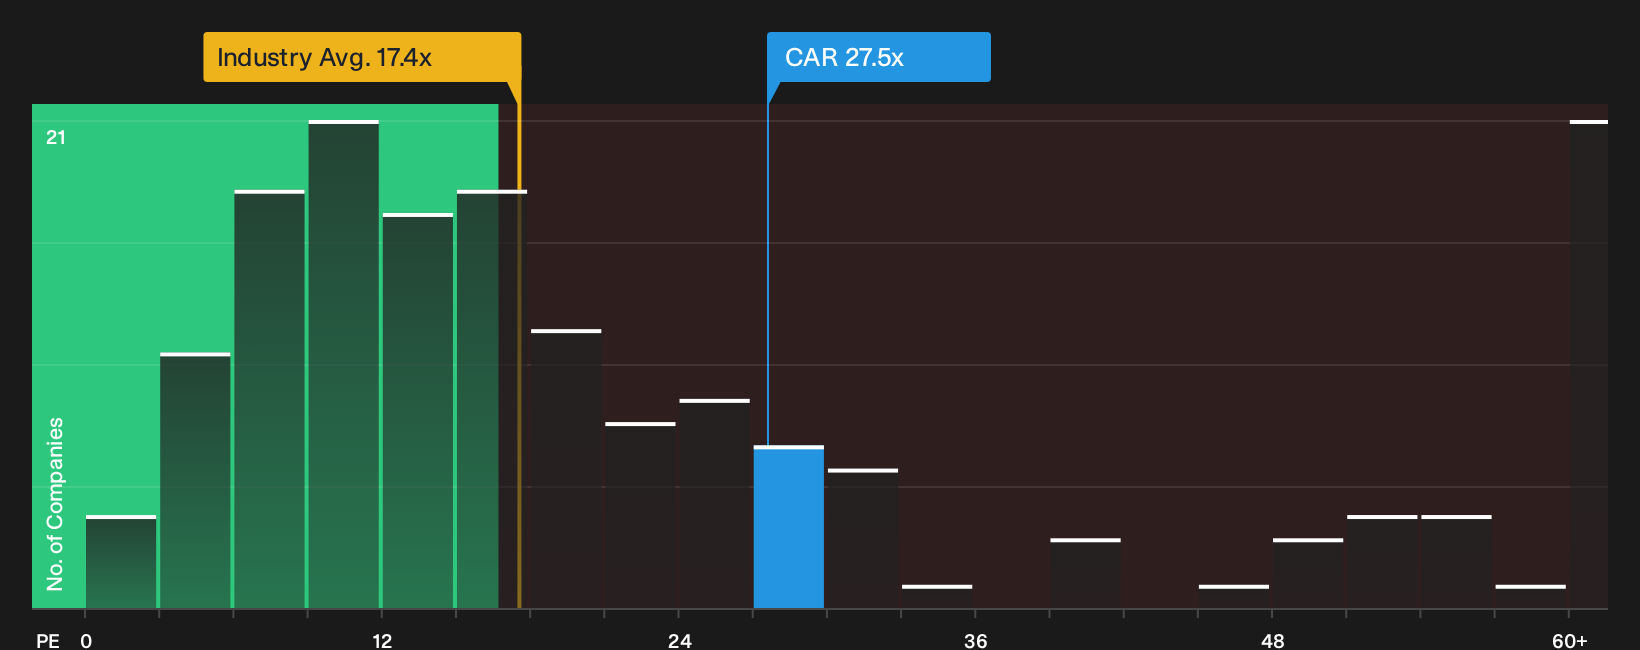
Multiples tell a different story to that A$32.0 narrative fair value. CAR Group trades on a P/E of 27.5x, richer than the global Interactive Media and Services average of 17.4x and slightly above its own fair ratio of 25.6x. Is that premium a comfort or a warning sign for you?
For investors who lean on relative pricing and want to see how the market’s current P/E premium could evolve over time, See what the numbers say about this price — find out in our valuation breakdown.
Next Steps
Mixed messages on CAR Group so far. If you want to move fast and build your own conviction, start by weighing its 4 key rewards and 2 important warning signs
Looking for more investment ideas beyond CAR Group?
You have seen how one stock can split opinion. Now broaden your watchlist with a few focused idea lists built around clear, financial traits.
- Target resilience first and let price come second by scanning companies screened as 7 resilient stocks with low risk scores that may better match your comfort with volatility.
- Build an income orientated watchlist and stress test your cash flow plans against companies flagged as 6 dividend fortresses that clear a 5% yield hurdle.
- Hunt for quality at a discount and compare CAR Group with a wider pool of opportunities screened as 4 high quality undervalued stocks before the crowd catches up.
This article by Simply Wall St is general in nature. We provide commentary based on historical data and analyst forecasts only using an unbiased methodology and our articles are not intended to be financial advice. It does not constitute a recommendation to buy or sell any stock, and does not take account of your objectives, or your financial situation. We aim to bring you long-term focused analysis driven by fundamental data. Note that our analysis may not factor in the latest price-sensitive company announcements or qualitative material. Simply Wall St has no position in any stocks mentioned.
Have feedback on this article? Concerned about the content? Get in touch with us directly. Alternatively, email editorial-team@simplywallst.com