


Peloton Interactive (PTON) has been drawing fresh attention after recent trading showed a 4.1% one day gain and a similar move over the past week, bringing the share price to US$5.12.
That short burst of strength sits against a tougher backdrop for Peloton Interactive, with a 90 day share price return that declined 15.8% and a year to date share price move down 16.3%, while the 1 year total shareholder return is down 26.4% despite a small positive 3 year total shareholder return.
Scan Peloton Interactive's sharp swings against a curated group of fitness and consumer names with resilient balance sheets in the list of solid balance sheet and fundamentals (25 results) to see how this volatility compares.
For Peloton Interactive, a short pop to US$5.12 sits against years of heavy drawdowns and mixed recent returns. Does that tilt the next chapter toward fresh upside for new buyers, or suggest the risk premium is still too thin?
Most Popular Narrative: 28% Overvalued
On this framework, Peloton Interactive screens on a fair value of $4.00 versus the recent $5.12 close, which puts the spotlight on execution risk and competitive pressure rather than quick upside.
The rapid pace of innovation in new fitness technologies such as virtual reality, advanced wearables, and AI-driven platforms threatens to outpace Peloton's R&D investment and product pipeline. This raises the risk that the company will lose relevance or cede market share to better capitalized or more agile competitors, ultimately depressing revenue growth and jeopardizing earnings sustainability.
See why 2 investors see Peloton Interactive as 28% overvalued.
Result: Fair Value of $4.00 (OVERVALUED)
Still, Peloton Interactive could surprise if its push into holistic wellness gains traction and if commercial partnerships through Precor turn into steadier institutional demand.
Find out about the key risks to this Peloton Interactive narrative.
Another View: DCF Points In The Opposite Direction
A different lens tells a very different story for Peloton Interactive. The SWS DCF model estimates a value of $19.04 per share, compared with the current $5.12 price and the $4.00 fair value from the bearish narrative. That gap suggests the risk might be missing upside rather than overpaying.
For readers who want to see how those cash flow assumptions stack up line by line, Look into how the SWS DCF model arrives at its fair value.
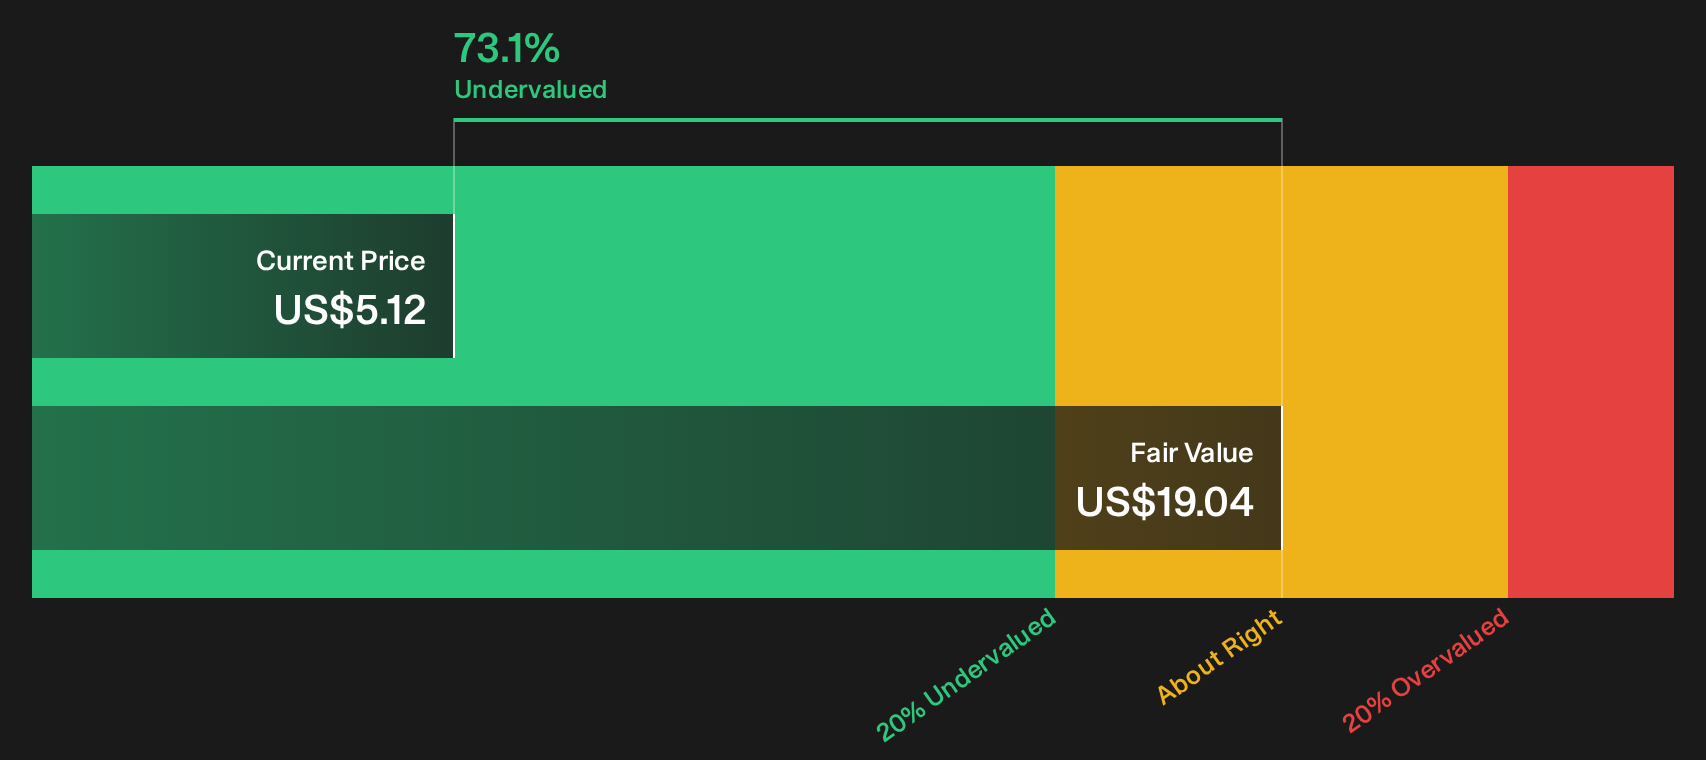
Simply Wall St performs a discounted cash flow (DCF) on every stock in the world every day (check out Peloton Interactive for example). We show the entire calculation in full. You can track the result in your watchlist or portfolio and be alerted when this changes, or use our stock screener to discover 29 high quality undervalued stocks. If you save a screener we even alert you when new companies match - so you never miss a potential opportunity.
Next Steps
Peloton Interactive has plenty of opinions swirling around it, but your money needs your own conviction. Move quickly from headline takes to hard numbers and stress test both the upside and downside using the 3 key rewards and 3 important warning signs.
Looking for more Peloton Interactive sized opportunities?
If Peloton Interactive has your attention, do not stop here. Use fresh screeners to spot other compelling setups before everyone else does.
- Zero in on strong cash flows and solid fundamentals by reviewing companies highlighted in the 29 high quality undervalued stocks.
- Strengthen portfolio resilience by focusing on businesses with healthier finances using the list of solid balance sheet and fundamentals (25 results).
- Hunt for lesser known opportunities with robust metrics through the 20 high quality undiscovered gems.
This article by Simply Wall St is general in nature. We provide commentary based on historical data and analyst forecasts only using an unbiased methodology and our articles are not intended to be financial advice. It does not constitute a recommendation to buy or sell any stock, and does not take account of your objectives, or your financial situation. We aim to bring you long-term focused analysis driven by fundamental data. Note that our analysis may not factor in the latest price-sensitive company announcements or qualitative material. Simply Wall St has no position in any stocks mentioned.
Have feedback on this article? Concerned about the content? Get in touch with us directly. Alternatively, email editorial-team@simplywallst.com