


In the current landscape, Asian markets are navigating a complex environment characterized by geopolitical tensions and fluctuating energy prices, which have led to mixed performances across major indices. Amidst this volatility, investors often seek out undervalued stocks as potential opportunities for growth, focusing on those trading below their intrinsic value despite broader market challenges.
Top 10 Undervalued Stocks Based On Cash Flows In Asia
| Name | Current Price | Fair Value (Est) | Discount (Est) |
| Woori Financial Group (KOSE:A316140) | ₩32350.00 | ₩64511.82 | 49.9% |
| Shinhan Financial Group (KOSE:A055550) | ₩99500.00 | ₩195773.40 | 49.2% |
| Nissui (TSE:1332) | ¥1085.00 | ¥2155.77 | 49.7% |
| Monde Nissin (PSE:MONDE) | ₱6.40 | ₱12.68 | 49.5% |
| Kumagai GumiLtd (TSE:1861) | ¥1196.00 | ¥2370.12 | 49.5% |
| Innocean Worldwide (KOSE:A214320) | ₩17980.00 | ₩35756.38 | 49.7% |
| Double Medical Technology (SZSE:002901) | CN¥40.08 | CN¥79.00 | 49.3% |
| Chow Sang Sang Holdings International (SEHK:116) | HK$13.84 | HK$27.60 | 49.9% |
| Astellas Pharma (TSE:4503) | ¥2247.50 | ¥4494.42 | 50% |
| APAC Realty (SGX:CLN) | SGD0.52 | SGD1.04 | 49.8% |
Here's a peek at a few of the choices from the screener.
Shanghai Zijiang Enterprise Group (SHSE:600210)
Overview: Shanghai Zijiang Enterprise Group Co., Ltd. operates in various sectors including packaging, real estate, and investment management with a market cap of approximately CN¥10.01 billion.
Operations: Shanghai Zijiang Enterprise Group generates revenue through its operations in packaging, real estate, and investment management.
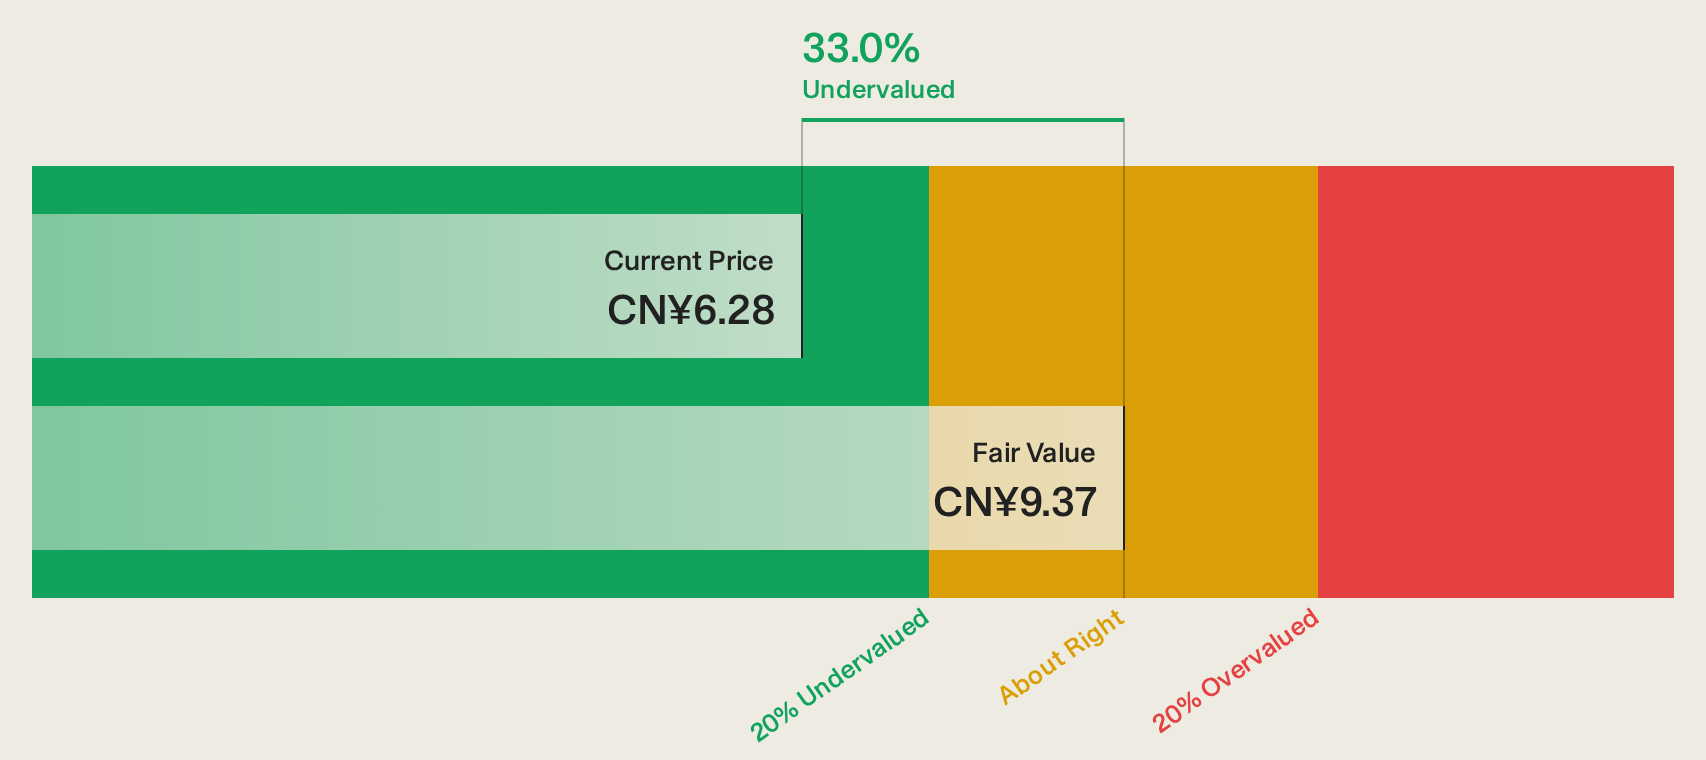
Estimated Discount To Fair Value: 29.6%
Shanghai Zijiang Enterprise Group is trading at 29.6% below its estimated fair value and is highly undervalued based on discounted cash flow, with a current price of CN¥6.6 against a future cash flow value of CN¥9.37. Despite recent earnings growth of 19.6%, the company's revenue and earnings are forecast to decline over the next three years, with revenue growing slower than the overall Chinese market rate.
- Upon reviewing our latest growth report, Shanghai Zijiang Enterprise Group's projected financial performance appears quite optimistic.
- Delve into the full analysis health report here for a deeper understanding of Shanghai Zijiang Enterprise Group.
Kingnet Network (SZSE:002517)
Overview: Kingnet Network Co., Ltd. develops, operates, and distributes mobile games in China and internationally, with a market cap of CN¥34.38 billion.
Operations: The company's revenue primarily comes from its Internet Software and Services segment, which generated CN¥7.54 billion.
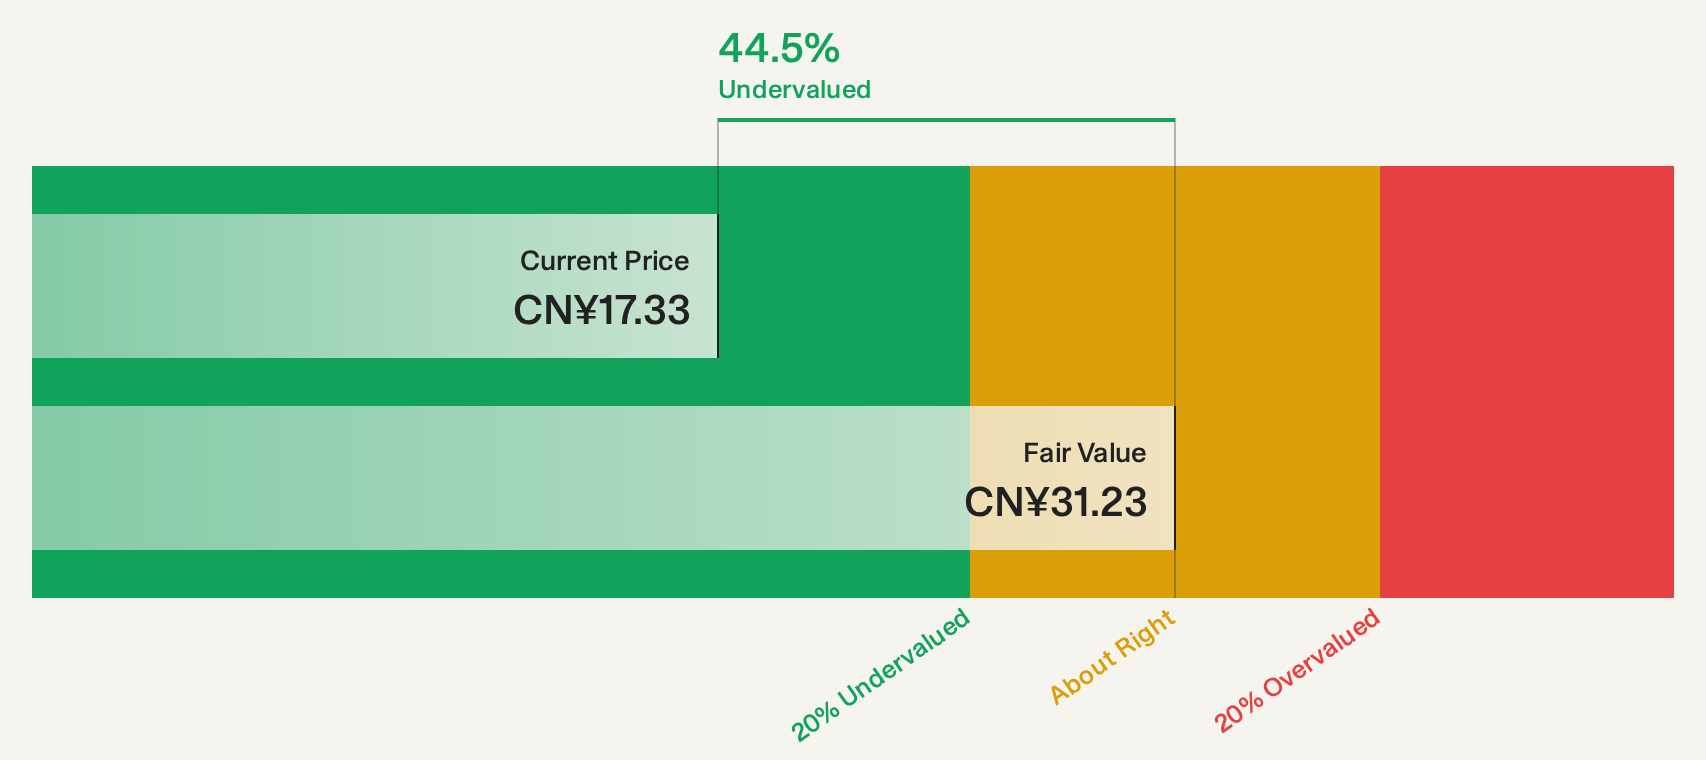
Estimated Discount To Fair Value: 47%
Kingnet Network is trading at 47% below its estimated fair value, with a current price of CN¥16.21 compared to a future cash flow value of CN¥30.56. Despite earnings growing by 34.6% over the past year and forecasted annual profit growth of 13.38%, this growth lags behind the broader Chinese market's rate. Recent half-year results showed sales nearly doubling to CN¥4,796.59 million, while net income increased significantly to CN¥1,428.32 million from last year’s figures.
- The analysis detailed in our Kingnet Network growth report hints at robust future financial performance.
- Click here and access our complete balance sheet health report to understand the dynamics of Kingnet Network.
Lancy (SZSE:002612)
Overview: Lancy Co., Ltd. operates in the design, production, and sale of apparel and medical services both in China and internationally, with a market capitalization of CN¥7.65 billion.
Operations: The company's revenue is derived from three main segments: Children's Wear (CN¥975.25 million), Women's Clothing (CN¥2.15 billion), and Medical Management (CN¥3.26 billion).
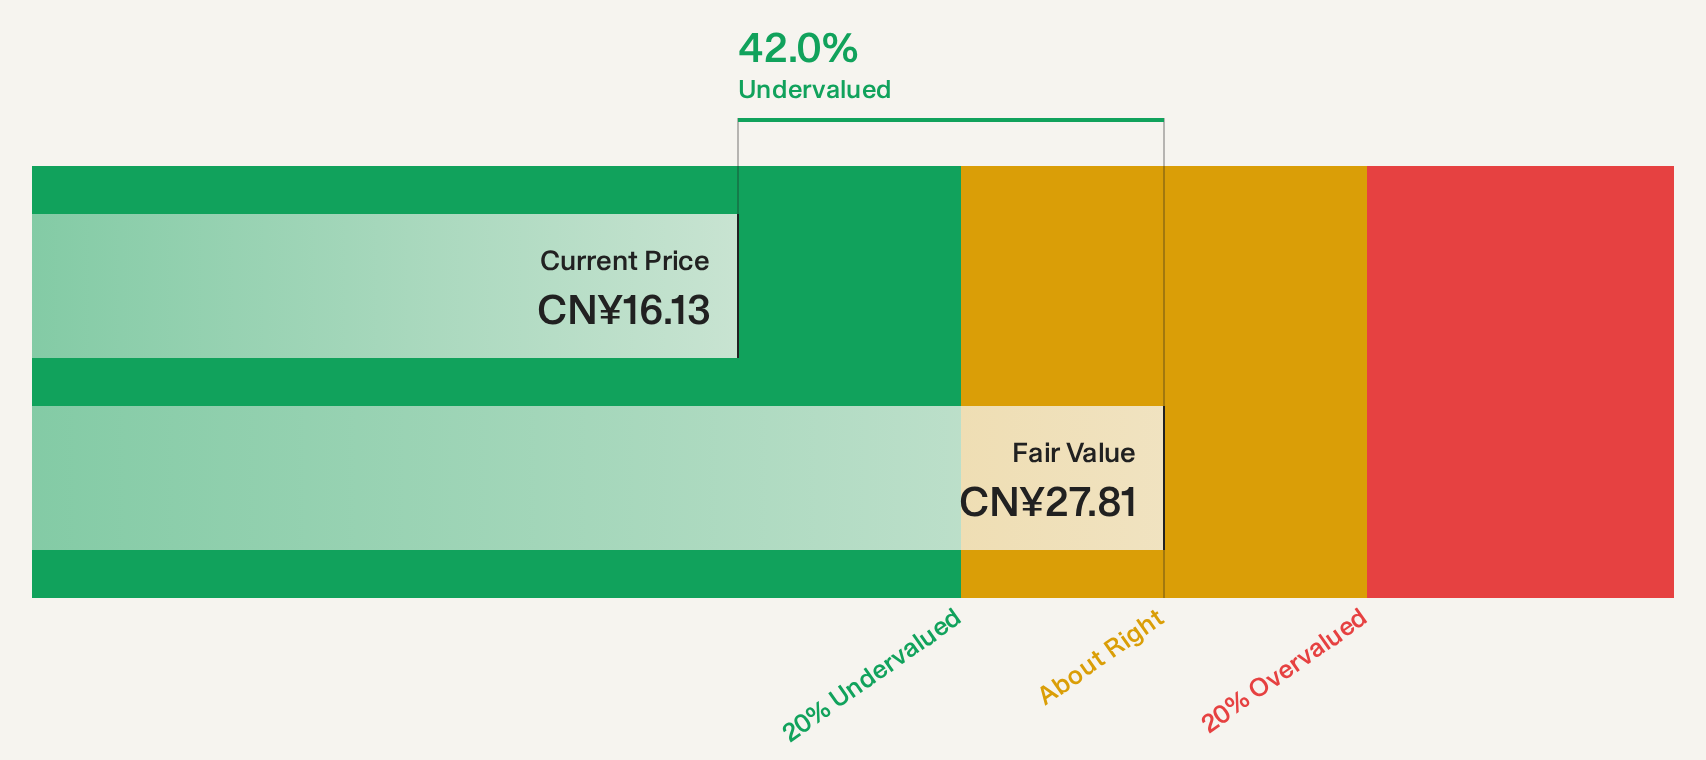
Estimated Discount To Fair Value: 38.3%
Lancy Co., Ltd. is trading at CN¥17.28, significantly below its estimated future cash flow value of CN¥28.02, highlighting potential undervaluation based on cash flows. Despite a 124.2% earnings growth last year, forecasts predict a 9.7% annual decline in earnings over the next three years, with revenue growth expected to lag behind the market at 14.7%. Recent half-year results showed increased sales and revenue but a drop in net income to CN¥111.29 million from CN¥277.82 million previously.
- The growth report we've compiled suggests that Lancy's future prospects could be on the up.
- Click to explore a detailed breakdown of our findings in Lancy's balance sheet health report.
Key Takeaways
- Take a closer look at our Undervalued Asian Stocks Based On Cash Flows list of 179 companies by clicking here.
- Already own these companies? Link your portfolio to Simply Wall St and get alerts on any new warning signs to your stocks.
- Streamline your investment strategy with Simply Wall St's app for free and benefit from extensive research on stocks across all corners of the world.
Seeking Other Investments?
- Explore high-performing small cap companies that haven't yet garnered significant analyst attention.
- Diversify your portfolio with solid dividend payers offering reliable income streams to weather potential market turbulence.
- Fuel your portfolio with companies showing strong growth potential, backed by optimistic outlooks both from analysts and management.
This article by Simply Wall St is general in nature. We provide commentary based on historical data and analyst forecasts only using an unbiased methodology and our articles are not intended to be financial advice. It does not constitute a recommendation to buy or sell any stock, and does not take account of your objectives, or your financial situation. We aim to bring you long-term focused analysis driven by fundamental data. Note that our analysis may not factor in the latest price-sensitive company announcements or qualitative material. Simply Wall St has no position in any stocks mentioned.
Have feedback on this article? Concerned about the content? Get in touch with us directly. Alternatively, email editorial-team@simplywallst.com