


The Zhitong Finance App learned that the Goldman Sachs stock strategy team upgraded the three-month rating of global stocks from neutral to overrated, in line with its one-year bullish stance that it was originally established. The reason the team wrote in the report is that the rise in oil prices and bond yields has brought the previous gains to a standstill, and valuation pressure has eased as a result, while the company's profit prospects are still stable.
“Earnings growth continues to support the stock market, and the recent fall in valuations has improved the risk-to-return ratio entering the third quarter earnings season,” said Christian Mueller-Glissmann (Christian Mueller-Glissmann), head of the team.
Let me first explain the nature of this increase. It's a tactical rating at the asset allocation level, not a point prediction — Goldman Sachs's target of 8,000 points for the S&P 500 by the end of 2026 (up from 7,600 points in May) is another matter, and there are no new point judgments in this report. According to the latest brokerage target, 8,000 points are roughly in the middle optimistic position: Bank of America Global Research gave 7,400 points; Barclays gave 7,950 points; J.P. Morgan, Deutsche Bank, Morgan Stanley and Goldman Sachs received 8,100 points.
Profit threshold
The upside bet this time is a “high-risk earnings season.” According to data compiled according to industry research, analysts expect profits of S&P 500 components to increase 25% year-on-year in the third quarter, which is one of the best growth rates in history; the Goldman Sachs team believes the actual results will surpass this threshold.
If the same thing is changed to a set of statistical standards, the height of the threshold will change. According to FactSet, S&P 500's earnings per share for the third quarter are expected to increase 29.5% year-on-year and revenue increase by 12.3%. If realized, it will be the third consecutive quarter of growth of more than 25% and the eighth consecutive quarter to maintain double-digit growth; it is expected to grow 27.6% in the fourth quarter and 32.4% for the full year of 2026 (data as of October 2). There is a 4.5 percentage point difference between 25% and 29.5%. Which one Goldman Sachs wants to “surpass” directly determines the gold content of this sentence.
This time's expectations were not revised all the way down before the earnings season. FactSet notes that from the end of June to the end of September, the S&P 500 earnings forecast for the third quarter was revised by about 1.4%, compared to an average of 2.2% for the same period of the past five years; as of September 25, 72 (62%) of the 116 companies that have issued quarterly guidance gave positive guidance, far higher than the five-year average of 40%.
What is more noteworthy is the concentration of profit growth. According to an analysis by ZeroHedge citing Goldman Sachs and FactSet's earnings forecasts, Nvidia (NVDA.US) and Micron (MU.US) are expected to account for more than one-third of the S&P 500 earnings per share increase in the third quarter, contributing more than the 490 companies ranked lower in the index; AI infrastructure-related companies are expected to contribute more than half of the quarter's earnings per share increase. Barclays estimates show figures in the same direction: semiconductors and technology hardware together account for only 29% of the S&P 500's weight, yet they contributed about 75% of the earnings per share increase in fiscal year 2027, and are expected to contribute about 70% of the index's earnings growth for the year.
Barclays also conducted a stress test: if semiconductor earnings per share are lowered by 15% in fiscal year 2027 and profits from other industries remain unchanged, the S&P 500 is still expected to achieve double-digit growth above the long-term trend; if semiconductors decline at the same time as other industries, the index growth rate may fall back close to the long-term trend. The premise of the existence of this cushion is that other industries will not go down with it.
The quality of earnings also left a gap. According to a reminder from Carson Wealth Management on October 7, earnings in the technology sector are expected to increase by about 65% in the third quarter. Part of this comes from investment income from holdings in SpaceX, OpenAI, etc. — this part is book value addition, not cash. Once the AI boom slows down, it may reverse.
“Valuation Has Been Digested”: Evidence and Disproof
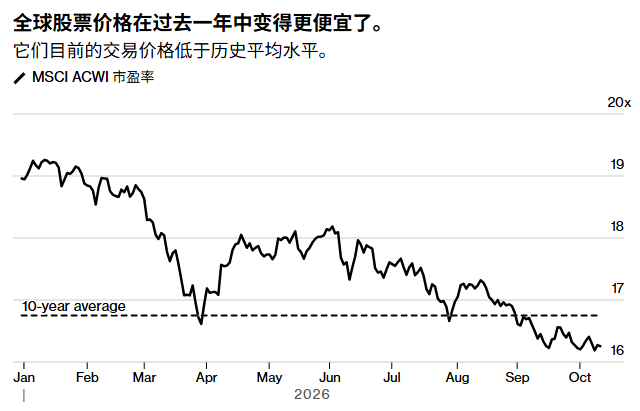
Goldman Sachs's logical starting point is “pullbacks lower valuations.” This is supported by data: the projected 12-month price-earnings ratio of the S&P 500 has fallen from 20.4 times at the end of June to 19.0 times, below the five-year average of 19.8 times and basically the same as the 10-year average of 19.1 times (FactSet, as of October 2).
But if you look at stocks and bonds together, the conclusion will be reversed. According to data from October 9, the S&P 500 forward-looking profit yield is 4.33% and the 10-year US Treasury yield is 5.24%. The difference between the two is -91 basis points — that is, the profit return on holding stocks is lower than the interest on holding treasury bonds. It is at the 11th percentile of this indicator's history since 1990, and the historical median value is +198 basis points.
The same goes for a bolder version: According to Shiller's long-term data, the simple difference between the S&P 500 profit margin minus the 10-year US Treasury yield was -1.42% on October 1, at the 10.3rd percentile, with an historical average of +2.71%; Shiller's “excess CAPE yield” reading in October was 0.56 points, the lowest value since March 2002.
This is the opposite of the phrase “risk-benefit ratio improvement”: the valuation did fall from a high level, but it fell back to a position where “the difference in yield on equity bonds is close to zero.” Based on 7,802 points and forward-looking earnings of approximately $411 per share, for every 1 time change in the price-earnings ratio, the index corresponds to a fluctuation of about 410 points — 17 times corresponds to about 6,981 points (-10.5%), and 21 times corresponds to about 8,623 points (+10.5%). In this position, a slight drop in profit expectations will be more likely to be amplified than usual.
Barbells, regions, and the Asia Report 10 days ago
The allocation structure proposed by Goldman Sachs is a “barbell strategy”: one end is global technology stocks, and the other end is selected interest-sensitive “bond-like” stocks whose valuations have been digested since the summer. Regionally, it maintains an overmatch between Asia and the United States, and a lower profile for Europe.
The Asian one had a more complete version ten days ago. On October 8, Goldman Sachs released the global strategy report “Investing in a Competitive Asia” (Global Strategy Report No. 78), which gave the MSCI Asia Pacific (excluding Japan) index a 12-month target of 1,120 points, corresponding to a return of about 26% in dollar terms, and expected regional profits to grow 75% in 2026, 25% in 2027, and 14% in 2028 — previously from 2011 to 2025 The compound growth rate of regional profit was only 6%. It also raised the long-term forecast: the annual profit growth rate for the next ten years was raised from 9% to 10%, and the 10-year annualized dollar total return forecast was 13.6%, which is at the 89th percentile in history.
The report mentions that information technology will account for 47% of regional profits in 2026, and memory chips may account for about 70% of that; the risk is clearly stated in terms of concentration — the top six technology stocks account for 36% of the index's market value. Within the region, Goldman Sachs overranked A-shares in South Korea, Taiwan, Japan and China, and under-ranked Australia, Thailand, Indonesia, and the Philippines. Among them, South Korea's KOSPI's 12-month target was 12,000 points.
Europe is at the other end of this chain. According to a survey on September 18, strategists' mid-year target for the Stoxx Europe 600 Index was 670 points, the most optimistic since 2018; Goldman Sachs is maintaining a low profile for Europe this time. The two are not necessarily contradictory — one is the target price and the other is the regional allocation weight, but the difference in direction is clear: Goldman Sachs macro trader Rikin Shah (Rikin Shah) judged that the US is clearly the winner of the artificial intelligence wave, while Europe is not the case. If interest spreads on sovereign bonds widen again, it will further tighten Europe's financial environment. In the European stock market on October 12, the Stoxx 600 index rose 0.56% to 635.09 points, and there is still room for about 5% of the 670 point target.
The real point of changing the word of mouth lies in bonds
What is more worth reading than stock ratings in this report is the bond section. Goldman Sachs's three-month rating of the bond remained neutral, but raised the 12-month rating to an overfit, and gave a sentence that rarely appears in seller reports: “We believe that bonds should gradually shift from being a drag on the portfolio to a hedging tool.”
If you look at this sentence together with the stock one, the logic is complete: overallocating stocks and bonds for 12 months means Goldman Sachs earns corporate profits, and uses bonds to hedge against the two risks it has listed itself — higher interest rates and higher energy prices. This also explains why it treats “stocks become overallocated for 3 months” and “bonds remain neutral for 3 months” separately: interest rates are still rising within 3 months, and bonds are still under pressure, so they are unbalanced; after 12 months, the long-term period begins to become protection.
On the other side: Bank of America is hoarding cash
Not all sellers are going in the same direction. Michael Hartnett (Michael Hartnett) of Bank of America Securities gave a different set of judgments in the “Capital Flow Report” released on October 8: the US midterm elections on November 3 are the biggest potential catalyst to trigger positive or negative 10% fluctuations in global stock markets before the end of the year. The market forecast he quoted shows that the probability of the Democratic Party sweeping both houses has risen from 49% in September to 64%. If this scenario comes true, US stocks face a downside risk of more than 10%; the Bank of America's bullbear index fell from 8.8 to 8.1, continuing to maintain a “sell” signal.
The capital flow is on his side: the net inflow of funds from the global money market was US$166.4 billion this week, the largest weekly inflow since April 2020. The size of global money market funds had risen from US$5 trillion in 2023 to US$8 trillion; the net inflow of US Treasury bonds was US$16.6 billion; financial stocks experienced the biggest weekly net outflow since March 2026, about US$3 billion. Bank of America Global Research's target of 7,400 points for the S&P 500 by the end of 2026 is one of Wall Street's most cautious predictions. Analyst Savita Subramanian (Savita Subramanian) raised it from 7,100 points to 7,400 points in September, while still alerting to interest rate risks.
The historical statistics of the midterm elections could provide ammunition for both sides. According to data from LPL Financial, in the 17 midterm elections since 1954, the S&P 500 rose 12 months after the election, with an average increase of 18.2%; however, the average maximum retracement in the midterm election year itself was 19.4%, and only 12.5% in other years (since 1960). In other words, fluctuations and returns occurred one after the other in such years, rather than being absent at the same time.
Back to that variable that can be tested: whether this round of the market can last until the end of the year depends on whether the profit threshold of 25% to 29.5% is crossed or bypassed. In a position where the S&P 500 is only one line away from the historical closing high, and in a valuation structure where the difference in bond yields has been reduced to zero, Goldman Sachs chose to increase stock positions, and Bank of America chose to hoard cash — both companies are waiting for the same batch of financial reports.