


GEO Group (GEO) just rewired its balance sheet in a big way. Management is redeeming US$650 million of 8.625% senior secured notes and increasing capacity for a US$1.25 billion share repurchase program.
These moves come after a powerful run in GEO Group’s shares. The year-to-date share price return is 95.42% and the 1-year total shareholder return is 79.63%. The recent 7-day share price pullback of 3.74% and 30-day share price return of 1.14% suggest that momentum is pausing rather than accelerating following the buyback and debt redemption announcements.
Compare GEO Group’s aggressive balance sheet reset with a hand-picked list of companies that also pair debt discipline with shareholder returns by scanning the list of solid balance sheet and fundamentals (25 results).
GEO Group now combines debt cleanup with a large buyback pool. The business looks stronger on paper. The real question is whether the current share price already reflects that reset.
Most Popular Narrative: 18% Undervalued
GEO Group’s most followed narrative puts fair value at $37.75 against a last close of $31.13, so the gap rests squarely on whether future contracts and bed activations materialize as outlined.
The federal funding package that provides ICE with multi year access to US$45b for detention expenditures and US$38.5b of broader funding is supporting ICE plans to increase total detention capacity toward 100,000 or more beds, which could allow GEO Group to activate additional contracted and idle facilities and lift revenue and adjusted EBITDA if its share of beds continues to rise.
See why 29 investors see GEO Group as 18% undervalued.
Result: Fair Value of $37.75 (UNDERVALUED)
Still, the GEO Group story depends heavily on multi year ICE detention funding and contract execution, so policy shifts or contract pauses could quickly challenge that view that the stock is 18% undervalued.
Find out about the key risks to this GEO Group narrative.
Another View On GEO Group’s Valuation
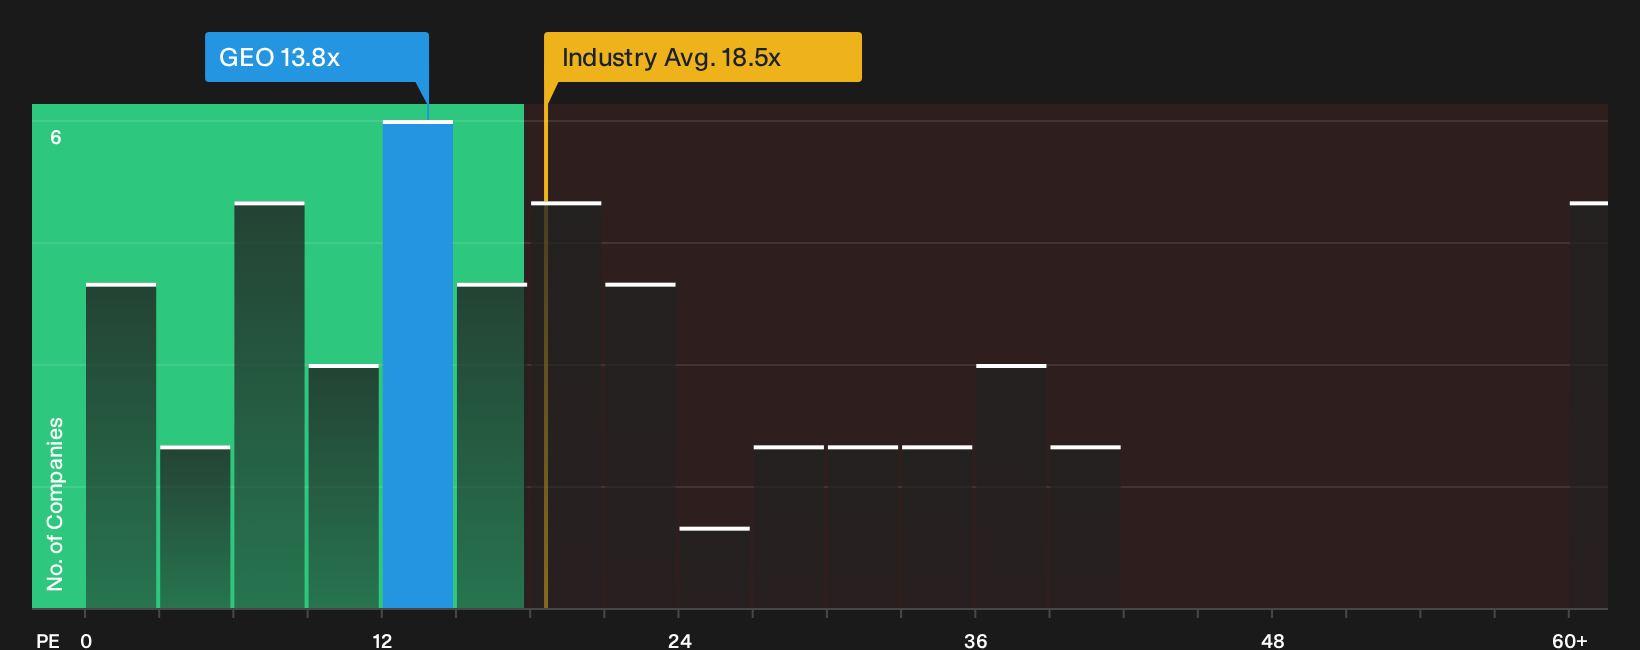
Multiples paint a different picture. GEO Group trades on a P/E of 13.8x, below the US Commercial Services average of 18.5x and the peer average of 27.3x, yet above its own fair ratio of 12.1x. That gap suggests some upside story already baked in, so the key question is how much mispricing is really left on the table.
For a closer look at how this P/E compares with peers and the fair ratio the market could move toward, See what the numbers say about this price — find out in our valuation breakdown..
Next Steps
Mixed signals on GEO Group’s valuation and risk profile can feel messy, so move fast, review the underlying data yourself, and weigh the 3 key rewards and 4 important warning signs.
Hunting For More GEO Group Style Ideas?
Do not stop with GEO Group. Broaden your watchlist now with a few focused screens that surface different types of opportunities regular headline flow can miss.
- Target potential mispricing by running a focused search for companies that look cheap on quality and fundamentals through the 29 high quality undervalued stocks.
- Strengthen your income stream by filtering for companies that combine high yields with resilience using the 8 dividend fortresses.
- Dial down portfolio stress by zeroing in on stocks with sturdier finances via the 31 resilient stocks with low risk scores.
This article by Simply Wall St is general in nature. We provide commentary based on historical data and analyst forecasts only using an unbiased methodology and our articles are not intended to be financial advice. It does not constitute a recommendation to buy or sell any stock, and does not take account of your objectives, or your financial situation. We aim to bring you long-term focused analysis driven by fundamental data. Note that our analysis may not factor in the latest price-sensitive company announcements or qualitative material. Simply Wall St has no position in any stocks mentioned.
Have feedback on this article? Concerned about the content? Get in touch with us directly. Alternatively, email editorial-team@simplywallst.com