


Analyst upgrade puts Terreno Realty in focus
BMO Capital’s move to lift Terreno Realty (TRNO) from Market Perform to Outperform on October 12, 2026, has pushed the industrial REIT onto more investors’ radars.
The call arrives with the shares around $66.10 and a history of owning and operating logistics oriented properties across key U.S. coastal markets.
Terreno Realty’s recent leasing activity in Florida has unfolded alongside a share price that has risen 12.0% year to date, with a 1-year total shareholder return of 19.95%. However, the 90-day share price return has slipped 7.07%, suggesting longer term momentum remains intact even as short term sentiment has cooled.
Scan how Terreno Realty compares with other industrial and real estate players by reviewing our curated list of list of solid balance sheet and fundamentals (25 results) in one place.
The upgrade and recent Florida leasing news both point to progress in Terreno Realty’s operations, yet the shorter term pullback hints at sentiment fatigue. How does that mix appear in the current valuation?
Price-to-earnings of 18.6x: Is it justified?
Terreno Realty changes hands at a P/E of 18.6x, a level that places the stock below its peer group on some measures yet above the broader industrial REIT cohort.
The P/E ratio compares the current share price with the last 12 months of earnings per share. For an owner and operator of industrial property like Terreno Realty, that metric quickly shows how much investors are paying today for each dollar of recent profit.
On one side, our fair P/E estimate sits at 25.5x, which is well above the current 18.6x. That gap suggests the market could be assigning a lower valuation multiple than the earnings profile might support if results normalise once one off items fade. On the other side, the stock trades at 18.6x against a global industrial REIT average of 15x. This points to a premium compared with the wider group even as it sits below the peer subset referenced in the fair ratio work.
Explore the SWS fair ratio for Terreno Realty.
Result: Price-to-earnings of 18.6x (ABOUT RIGHT)
Still, Terreno Realty’s narrative can be challenged if leasing momentum slows or if early termination decisions fail to translate into stronger long term cash flows.
Find out about the key risks to this Terreno Realty narrative.
Another View on Terreno Realty’s value
A second lens tells a slightly different story. Our DCF model puts Terreno Realty’s future cash flow value at $66.55, only 0.7% above the recent $66.10 share price. That is very close. The question is whether you see that tight gap as comfort or a margin that is too slim.
Look into how the SWS DCF model arrives at its fair value.
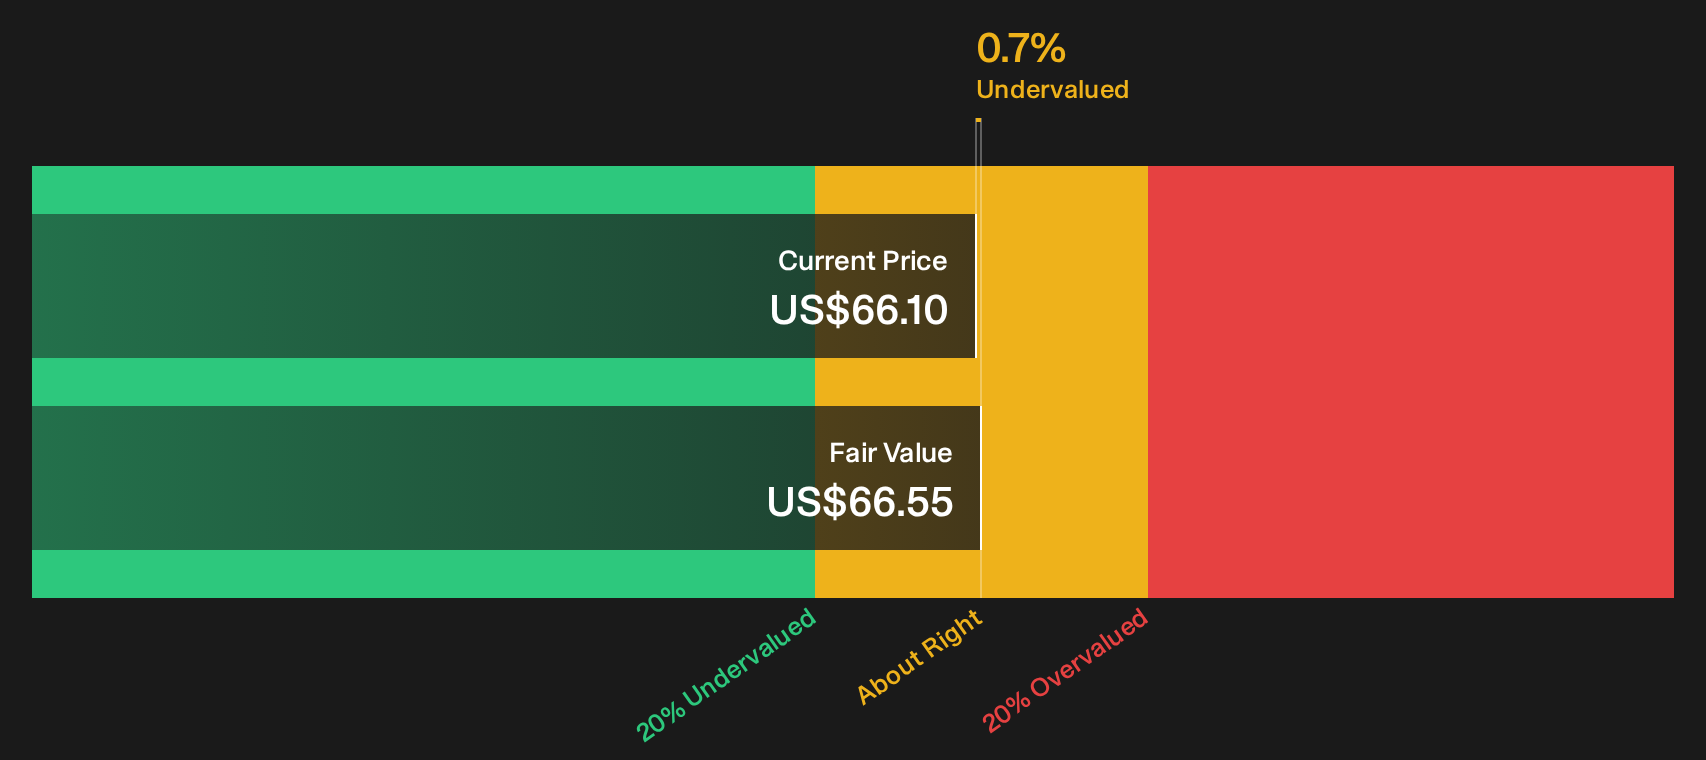
Simply Wall St performs a discounted cash flow (DCF) on every stock in the world every day (check out Terreno Realty for example). We show the entire calculation in full. You can track the result in your watchlist or portfolio and be alerted when this changes, or use our stock screener to discover 29 high quality undervalued stocks. If you save a screener we even alert you when new companies match - so you never miss a potential opportunity.
Next Steps
If this mix of upgrade, leasing progress and a tight valuation range around Terreno Realty leaves you undecided, do not remain that way for long. Review the full picture of potential downsides and upsides for yourself by checking out the 3 key rewards and 3 important warning signs
Looking for more ideas beyond Terreno Realty?
If Terreno Realty has sharpened your thinking, do not stop there. Use the Simply Wall St screener to widen your watchlist with fresh, data driven opportunities.
- Target dependable cash generators by scanning a curated 29 high quality undervalued stocks that combines quality fundamentals with valuations that may leave room for upside.
- Prioritise resilience by reviewing a 31 resilient stocks with low risk scores built around balance sheet strength and lower risk scores so surprises are less likely to catch you off guard.
- Hunt for tomorrow’s standouts by checking a 20 high quality undiscovered gems that surfaces under the radar companies with solid financial underpinnings before the crowd arrives.
This article by Simply Wall St is general in nature. We provide commentary based on historical data and analyst forecasts only using an unbiased methodology and our articles are not intended to be financial advice. It does not constitute a recommendation to buy or sell any stock, and does not take account of your objectives, or your financial situation. We aim to bring you long-term focused analysis driven by fundamental data. Note that our analysis may not factor in the latest price-sensitive company announcements or qualitative material. Simply Wall St has no position in any stocks mentioned.
Have feedback on this article? Concerned about the content? Get in touch with us directly. Alternatively, email editorial-team@simplywallst.com