


In October 2026, global markets are experiencing a mix of volatility and growth, influenced by fluctuating oil prices due to Middle East tensions and ongoing adjustments in interest rates by central banks. Amidst these conditions, investors are closely watching the performance of major indices like the S&P 500 and Nasdaq Composite, which have shown resilience despite external pressures. In this environment, identifying undervalued stocks can be particularly appealing as they may offer opportunities for growth when market conditions stabilize. Evaluating stocks priced below their estimated worth involves considering factors such as financial health, industry position, and potential for recovery or expansion in light of current economic challenges.
Top 10 Undervalued Stocks Based On Cash Flows
| Name | Current Price | Fair Value (Est) | Discount (Est) |
| Valmet Oyj (HLSE:VALMT) | €26.82 | €53.02 | 49.4% |
| PORR (WBAG:POS) | €30.35 | €60.22 | 49.6% |
| Orthex Oyj (HLSE:ORTHEX) | €4.50 | €8.89 | 49.4% |
| Monde Nissin (PSE:MONDE) | ₱6.39 | ₱12.68 | 49.6% |
| Lindab International (OM:LIAB) | SEK127.00 | SEK251.23 | 49.4% |
| Innocean Worldwide (KOSE:A214320) | ₩18020.00 | ₩36014.70 | 50% |
| Inner Mongolia ERDOS ResourcesLtd (SHSE:600295) | CN¥14.14 | CN¥28.06 | 49.6% |
| ING Groep (ENXTAM:INGA) | €30.035 | €59.68 | 49.7% |
| Grupa Pracuj (WSE:GPP) | PLN54.70 | PLN108.75 | 49.7% |
| ALEC Holdings PJSC (DFM:ALEC) | AED1.27 | AED2.53 | 49.7% |
Underneath we present a selection of stocks filtered out by our screen.
Exail Technologies (ENXTPA:EXA)
Overview: Exail Technologies offers solutions in robotics, maritime, navigation, aerospace, and photonics technologies across various global regions and has a market cap of €2.12 billion.
Operations: Unfortunately, the revenue segment details for Exail Technologies are not provided in the text.
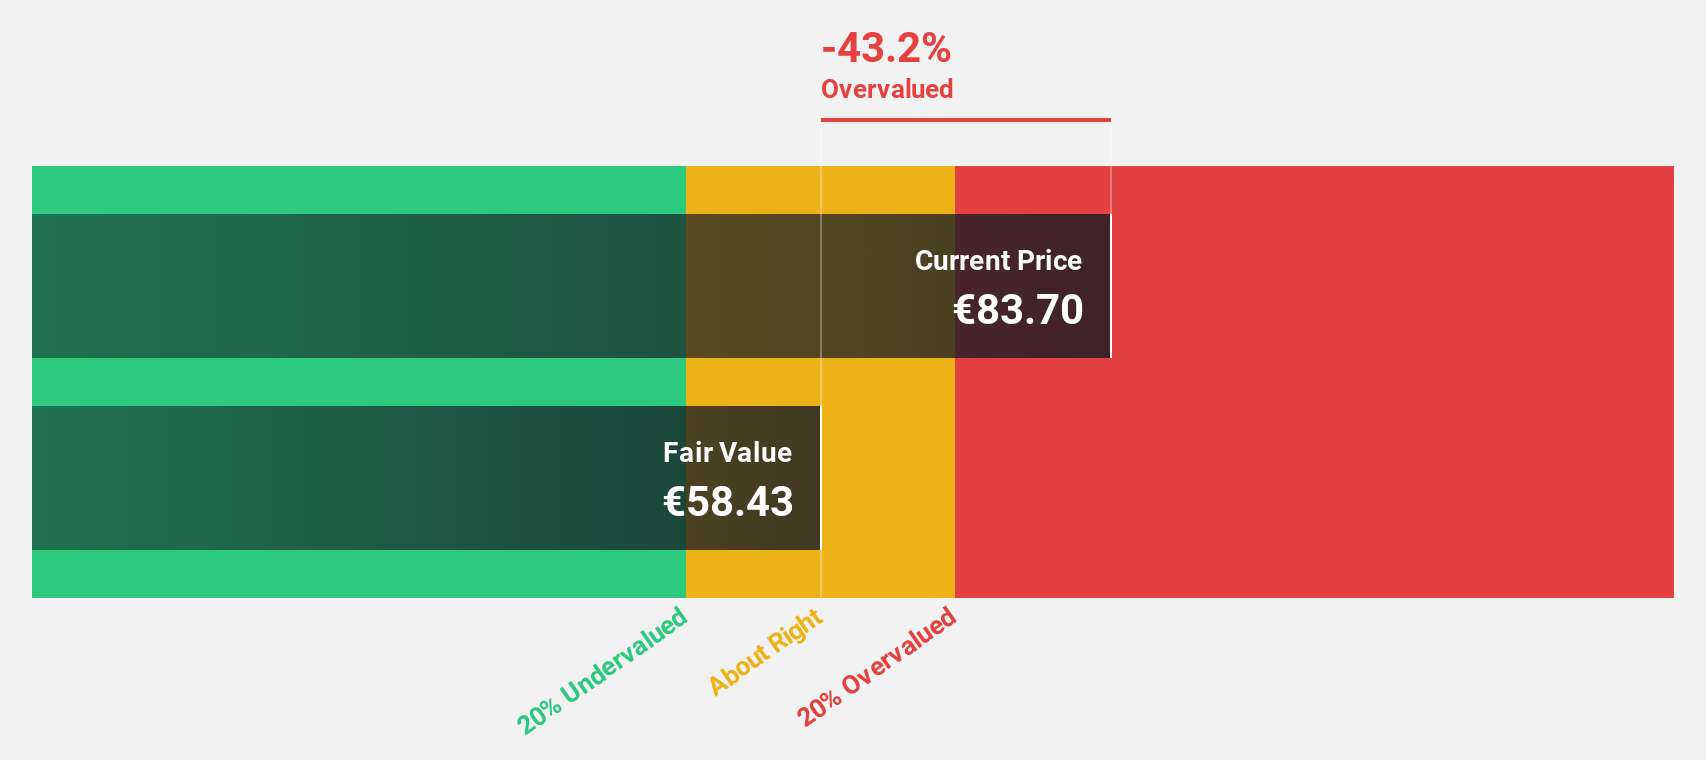
Estimated Discount To Fair Value: 21.9%
Exail Technologies, trading at €124.9, is undervalued based on its discounted cash flow value of €159.95. Despite a net loss reduction to €84.68 million for the half-year ending June 2026 and revenue growth to €274.75 million, the company faces challenges with complex financial instruments delaying earnings announcements. However, forecasted annual earnings growth of 22.2% surpasses market averages, supported by significant recent contracts in mine countermeasures technology that enhance its market positioning and revenue prospects.
- The analysis detailed in our Exail Technologies growth report hints at robust future financial performance.
- Unlock comprehensive insights into our analysis of Exail Technologies stock in this financial health report.
Inner Mongolia ERDOS ResourcesLtd (SHSE:600295)
Overview: Inner Mongolia ERDOS Resources Co., Ltd. operates in the clothing, power metallurgy, and chemical sectors in China with a market capitalization of CN¥34.69 billion.
Operations: The company's revenue is generated from its operations in the clothing, power metallurgy, and chemical sectors within China.
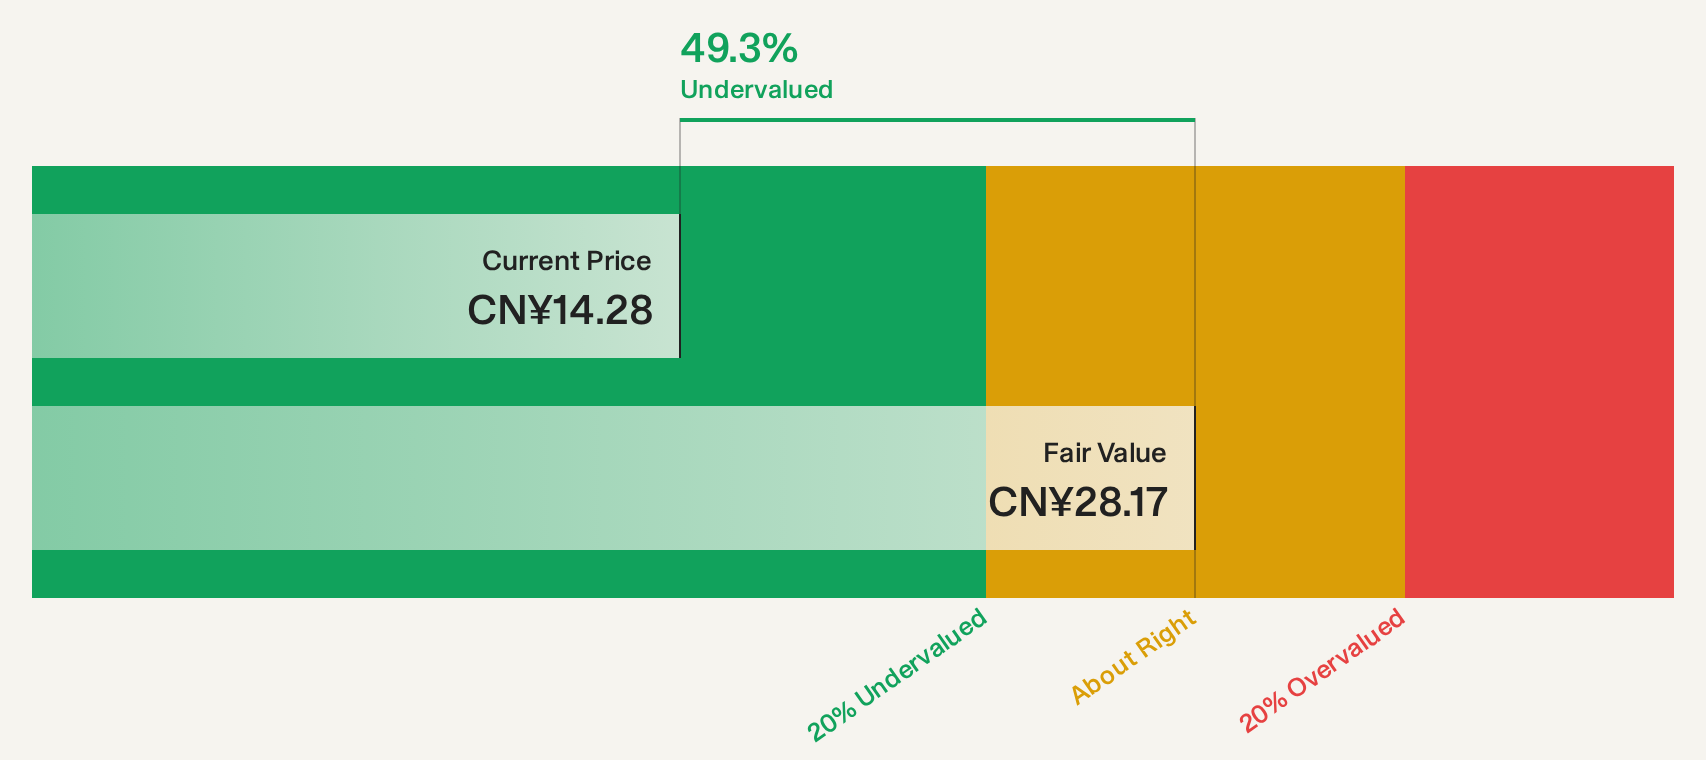
Estimated Discount To Fair Value: 49.6%
Inner Mongolia ERDOS Resources Ltd., trading at CN¥14.14, is significantly undervalued compared to its estimated cash flow value of CN¥28.06. The company reported strong earnings growth, with net income rising to CN¥1.42 billion for the first half of 2026 from CN¥988.67 million a year ago, despite revenue growth lagging behind market expectations at 6.5% annually. However, its return on equity is projected to remain low at 14.3%, and it has an unstable dividend track record.
- The growth report we've compiled suggests that Inner Mongolia ERDOS ResourcesLtd's future prospects could be on the up.
- Click here and access our complete balance sheet health report to understand the dynamics of Inner Mongolia ERDOS ResourcesLtd.
Kirin Holdings Company (TSE:2503)
Overview: Kirin Holdings Company, Limited operates in the food and beverages, alcoholic beverages, pharmaceuticals, and health science sectors with a market cap of ¥2.23 trillion.
Operations: The company's revenue segments include alcoholic beverages at ¥1.10 billion, non-alcoholic beverages at ¥604.75 million, pharmaceuticals at ¥529.80 million, and health science at ¥257.48 million.
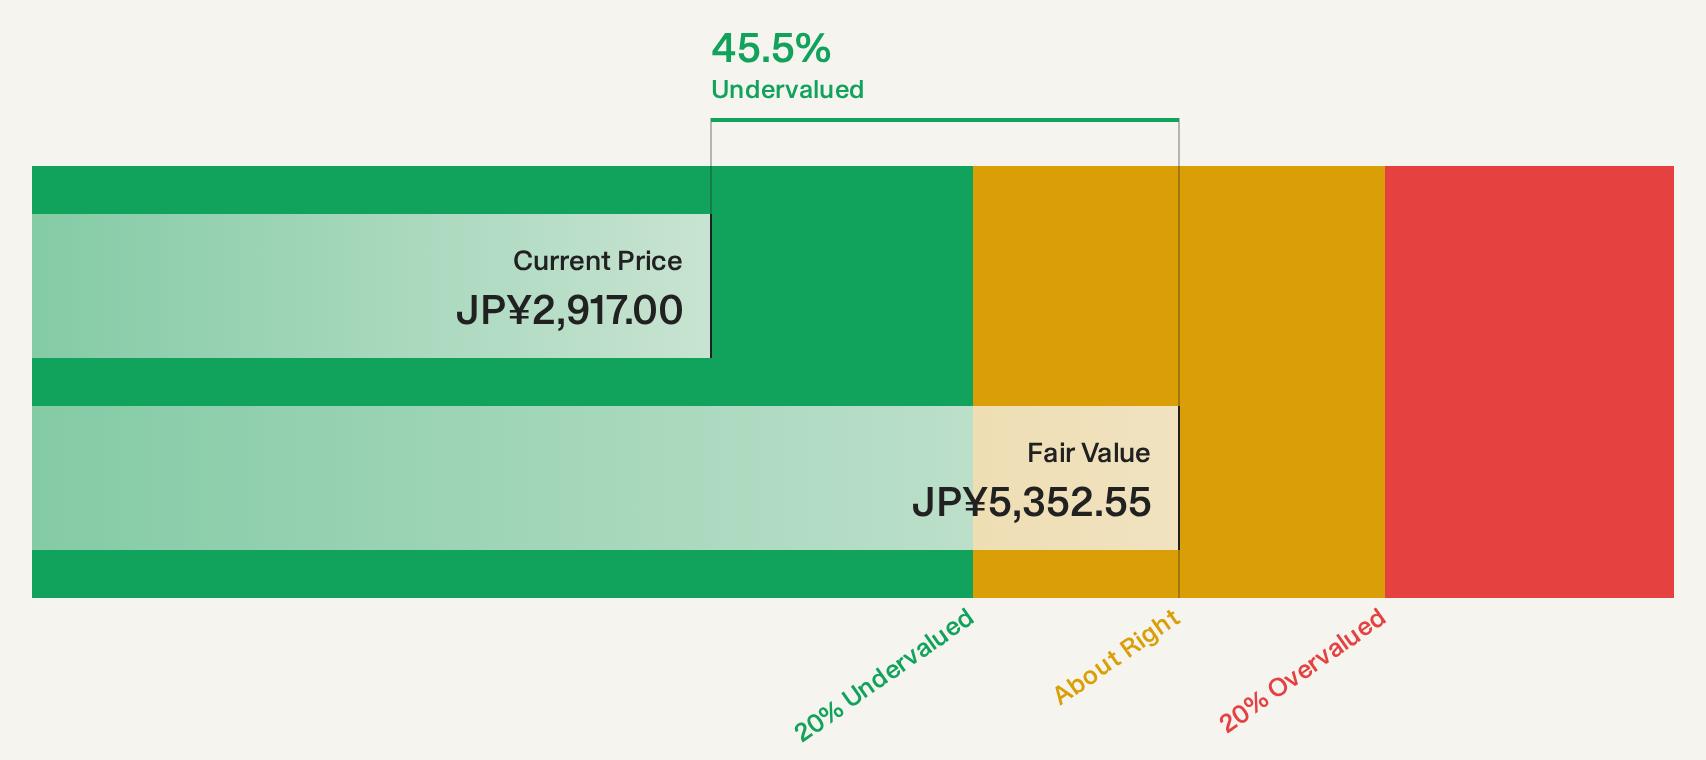
Estimated Discount To Fair Value: 46.6%
Kirin Holdings Company, trading at ¥2,857, is significantly undervalued with an estimated cash flow value of ¥5,352.55. Despite slow revenue growth forecasts at 2% annually and a modest earnings increase of 0.5%, the company maintains a reliable dividend yield of 2.66%. Recent strategic alliances with GenerativeX aim to enhance research capabilities using AI, potentially improving long-term innovation and efficiency in operations while recent share buybacks reflect strong capital management strategies.
- Our comprehensive growth report raises the possibility that Kirin Holdings Company is poised for substantial financial growth.
- Click to explore a detailed breakdown of our findings in Kirin Holdings Company's balance sheet health report.
Turning Ideas Into Actions
- Explore the 250 names from our Undervalued Global Stocks Based On Cash Flows screener here.
- Are these companies part of your investment strategy? Use Simply Wall St to consolidate your holdings into a portfolio and gain insights with our comprehensive analysis tools.
- Take control of your financial future using Simply Wall St, offering free, in-depth knowledge of international markets to every investor.
Seeking Other Investments?
- Explore high-performing small cap companies that haven't yet garnered significant analyst attention.
- Diversify your portfolio with solid dividend payers offering reliable income streams to weather potential market turbulence.
- Fuel your portfolio with companies showing strong growth potential, backed by optimistic outlooks both from analysts and management.
This article by Simply Wall St is general in nature. We provide commentary based on historical data and analyst forecasts only using an unbiased methodology and our articles are not intended to be financial advice. It does not constitute a recommendation to buy or sell any stock, and does not take account of your objectives, or your financial situation. We aim to bring you long-term focused analysis driven by fundamental data. Note that our analysis may not factor in the latest price-sensitive company announcements or qualitative material. Simply Wall St has no position in any stocks mentioned.
Have feedback on this article? Concerned about the content? Get in touch with us directly. Alternatively, email editorial-team@simplywallst.com