


Hirose Electric Ltd (TSE:6806) has wrapped up a share repurchase program that ran from August 4 to September 30, 2026, buying 569,000 shares, or 1.74% of outstanding equity, for ¥14,364.77 million.
At a share price of ¥25,045, Hirose ElectricLtd has cooled off in the past week with a 7 day share price return that declined 3.75%, yet the year to date share price return of 41.94% and 1 year total shareholder return of 38.10% still point to solid longer term momentum.
Scan how Hirose ElectricLtd’s buyback and momentum profile compares with other hand-picked Japanese stocks that screen well on balance sheet strength and fundamentals using our list of solid balance sheet and fundamentals (21 results)
After a buyback at higher levels and a sharp run this year, Hirose ElectricLtd now sits at ¥25,045 and has cooled in the short term. Does that set up a reasonable entry today, or a case for waiting?
Preferred P/E of 24.6x: Is it justified for Hirose Electric Ltd?
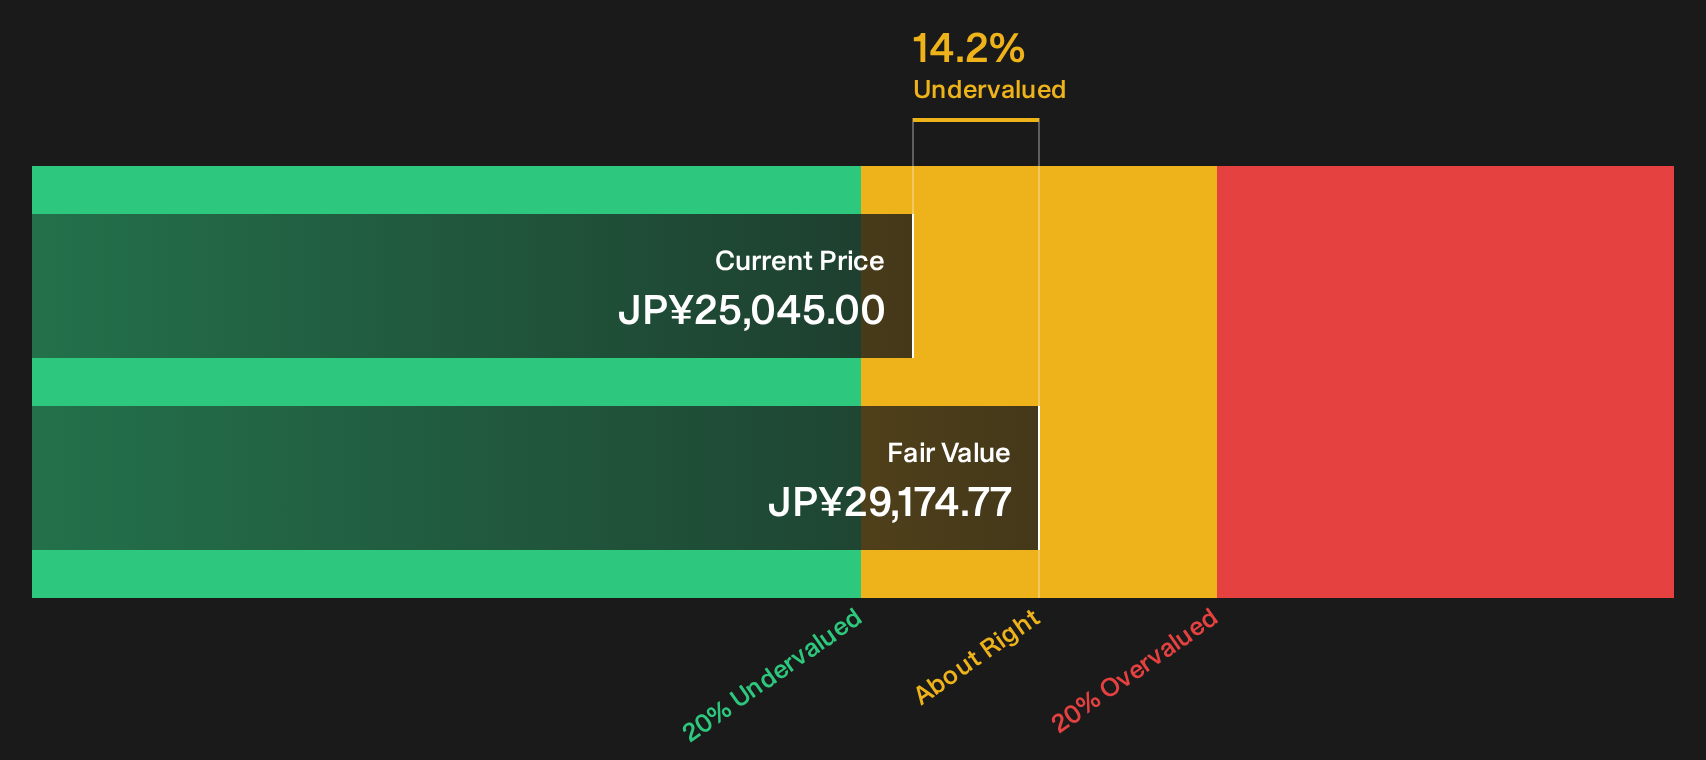
On simple earnings terms, Hirose Electric Ltd trades on a P/E of 24.6x, which prices the stock above the broader JP Electronic industry yet below its closer peer group, while the SWS DCF model suggests the current ¥25,045 level is below an estimated fair value of ¥29,174.77.
The P/E ratio compares what investors pay for each unit of earnings. For a connector manufacturer like Hirose Electric Ltd, that yardstick often reflects how consistently the business can turn specialist hardware demand into profits over time.
The share trades on a richer multiple than the JP Electronic sector average of 16.9x, which points to investors assigning a premium to Hirose Electric Ltd’s profile. At the same time, the stock changes hands at a discount to the peer group P/E of 32.2x, and the fair P/E estimate of 19.8x is well below the current 24.6x level. This creates a gap that the market could eventually close if sentiment cools on earnings expectations.
Explore the SWS fair ratio for Hirose ElectricLtd.
Result: Price-to-Earnings of 24.6x (OVERVALUED)
Still, Hirose Electric Ltd faces real pressure points if connector demand softens in key regions like China, or if higher expectations baked into that 24.6x P/E unwind quickly.
Find out about the key risks to this Hirose ElectricLtd narrative.
Another View on Hirose ElectricLtd’s Value
The P/E of 24.6x presents one view of Hirose ElectricLtd. The SWS DCF model presents another. On that measure, the current price of ¥25,045 sits below an estimated future cash flow value of ¥29,174.77, which suggests the stock may be trading at a discount rather than a premium.
Both perspectives cannot be correct over an extended period. Either earnings would need to increase to support today’s multiple, or the cash flow assumptions used in the DCF would need to be too optimistic. Which signal an investor relies on more will likely influence how they view Hirose ElectricLtd at this level.
Look into how the SWS DCF model arrives at its fair value.
Simply Wall St performs a discounted cash flow (DCF) on every stock in the world every day (check out Hirose ElectricLtd for example). We show the entire calculation in full. You can track the result in your watchlist or portfolio and be alerted when this changes, or use our stock screener to discover 12 high quality undervalued stocks. If you save a screener we even alert you when new companies match - so you never miss a potential opportunity.
Next Steps
Mixed signals on Hirose ElectricLtd so far. If you want to move before sentiment shifts again, consider those pressures and offsets for yourself by reviewing the 4 key rewards and 1 important warning sign
Looking for more Hirose Electric Ltd sized ideas?
Do not stop your research with Hirose Electric Ltd. A wider watchlist of resilient and well screened opportunities can help you spot better fits for your portfolio.
- Target resilience first and focus your attention on companies that score well on balance sheet strength and fundamentals through the list of solid balance sheet and fundamentals (21 results).
- Hunt for pricing gaps by reviewing the 12 high quality undervalued stocks that may offer stronger quality at more modest valuation levels than Hirose Electric Ltd.
- Aim for steadier portfolio cash flows by scanning the 27 dividend fortresses that combine higher yield potential with rigorous fundamental filters.
This article by Simply Wall St is general in nature. We provide commentary based on historical data and analyst forecasts only using an unbiased methodology and our articles are not intended to be financial advice. It does not constitute a recommendation to buy or sell any stock, and does not take account of your objectives, or your financial situation. We aim to bring you long-term focused analysis driven by fundamental data. Note that our analysis may not factor in the latest price-sensitive company announcements or qualitative material. Simply Wall St has no position in any stocks mentioned.
Have feedback on this article? Concerned about the content? Get in touch with us directly. Alternatively, email editorial-team@simplywallst.com