


Guidance upgrade and dividend increase reshape the Furuno Electric story
Furuno Electric (TSE:6814) lifted the tone around its stock after raising both interim and full year forecasts and pairing that move with higher dividends for the current fiscal period.
Investors have already reacted to the guidance and dividend news, with Furuno Electric’s share price delivering a 13.52% 1-month share price return and a 7.04% 3-month share price return. The 1-year total shareholder return of 12.97% and very large 3-year and 5-year total shareholder returns suggest momentum has been strong over a longer horizon despite a small decline year to date.
Scan how Furuno Electric’s upgraded guidance and higher dividends compare with 13 high quality undervalued stocks.
Bulls point to upgraded forecasts, richer dividends and strong Marine Business demand. Bears focus on rising component costs and the recent share price run. The key question is which side Furuno Electric’s current valuation leans toward now.
Preferred Price-to-Earnings of 15.4x: Is it justified?
Furuno Electric now trades on a P/E of 15.4x, and the share price of ¥8,060 reflects a valuation that screens as cheaper than both peers and the wider Electronic industry on this single metric.
The P/E ratio compares the current share price to earnings per share. For a business like Furuno Electric that already generates profits and has high quality earnings, this measure gives a simple snapshot of how much investors are currently paying for each unit of reported profit.
Furuno Electric is flagged as trading at good value relative to peers and the broader Electronic sector. The P/E of 15.4x sits below the Electronic industry average of 16.9x, which implies the market is applying a lower earnings multiple to the stock than to many competitors despite earnings being forecast to grow 5% per year.
The estimated fair P/E ratio of 17.6x is higher than the current 15.4x, which points to a level the market could move toward if sentiment around the business aligns more closely with that fair ratio model.
Explore the SWS fair ratio for Furuno Electric.
Result: Price-to-earnings of 15.4x (UNDERVALUED).
Still, rising component costs and the recent share price run could pressure Furuno Electric’s margins and limit how much value investors are willing to pay.
Find out about the key risks to this Furuno Electric narrative.
Another view: SWS DCF model sees Furuno Electric as overvalued
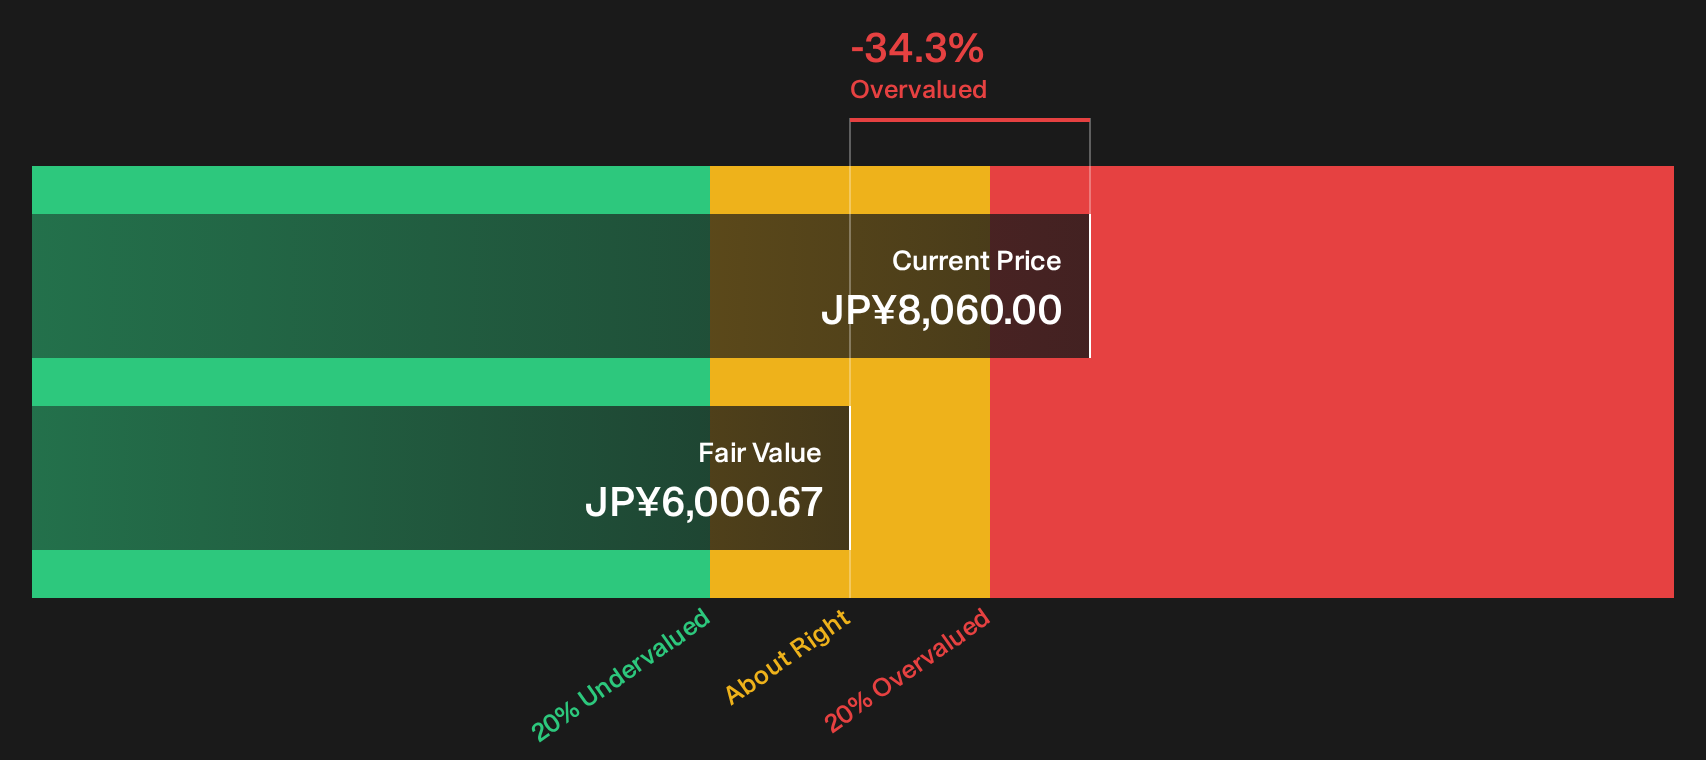
The P/E work presents Furuno Electric as inexpensive, yet the SWS DCF model points in the opposite direction. On that cash flow view, the estimated value sits at ¥6,000.67 per share while the market price is ¥8,060. That gap suggests investors are paying a premium and raises a simple question: Are you comfortable buying into the cash flows at this level.
Look into how the SWS DCF model arrives at its fair value.
Simply Wall St performs a discounted cash flow (DCF) on every stock in the world every day (check out Furuno Electric for example). We show the entire calculation in full. You can track the result in your watchlist or portfolio and be alerted when this changes, or use our stock screener to discover 13 high quality undervalued stocks. If you save a screener we even alert you when new companies match - so you never miss a potential opportunity.
Next Steps
Mixed messages on Furuno Electric’s value story. If you want a clear view fast, anchor it in the underlying numbers and the balance of risks and rewards. Start by weighing the 3 key rewards and 2 important warning signs
Looking for more Furuno Electric style investment ideas?
Do not stop with a single stock when a broader watchlist can help you spot what others might overlook. Use the Simply Wall Street Screener to pressure test Furuno Electric against other opportunities and keep your capital working where the risk and reward trade off suits you best.
- Target resilient balance sheets and steady business quality by scanning our list of solid balance sheet and fundamentals (21 results) that filters for financial strength and cleaner fundamentals.
- Zero in on potential value opportunities by reviewing a curated 13 high quality undervalued stocks that combines quality metrics with pricing that screens as attractive.
- Lock in on income focused opportunities by checking the 27 dividend fortresses that highlight higher yield payouts supported by underlying cash flows.
This article by Simply Wall St is general in nature. We provide commentary based on historical data and analyst forecasts only using an unbiased methodology and our articles are not intended to be financial advice. It does not constitute a recommendation to buy or sell any stock, and does not take account of your objectives, or your financial situation. We aim to bring you long-term focused analysis driven by fundamental data. Note that our analysis may not factor in the latest price-sensitive company announcements or qualitative material. Simply Wall St has no position in any stocks mentioned.
Have feedback on this article? Concerned about the content? Get in touch with us directly. Alternatively, email editorial-team@simplywallst.com