


John Salama, CMT
ETF Market Strategist & Derivatives Trader | CMT | Author, Physical Over Digital Alpha | Featured Author, Barchart | 500+ Institutional Subscribers
Tuesday’s session delivers a clear and selective rotation. (XLE) printed a fresh All-Time High alongside (MAGS) ; energy and mega-cap growth making history simultaneously while healthcare, industrials, and semiconductors absorbed institutional distribution. The tape is not broadly bearish. It is highly selective, rewarding confirmed trends and punishing anything that has lost momentum.
The five-day window tells the full rotation story: XLE +5% to an All-Time High, @UNG +4%, (XLP) +3% on the upside; energy and consumer staples leading. (EWY) -11%, (URA) -10%, (SOXX) -9% on the downside; South Korea, uranium, and semiconductors in sharp five-day breakdowns simultaneously. The same assets that led are now the distribution targets as October’s rotation hardens.
India catching a +1.9% daily bid alongside oil and gas exploration surging +2% adds an important EM and commodity dimension. The Physical Over Digital Alpha real asset and resource-rich EM thesis is asserting itself again after the Brazil-driven week last week.
SIGMA MOVERS
Multi-standard deviation displacements driving today’s price action:
Upside:
(XOP) +2% Oil and gas exploration delivering a strong single-session surge as energy maintains its dominant position across every time horizon. XOP’s +2% session on the same day XLE prints an All-Time High confirms the energy bid is broad across the full upstream complex, not concentrated in the sector ETF alone
(INDA) +2% India catching a strong institutional bid as EM capital flows rotate selectively into high-growth emerging markets. India’s economic growth trajectory and relative insulation from the South Korea semiconductor and uranium pressures make it a preferred EM destination in the current rotation
(SCMB) +0.6% Municipal bonds catching a quiet bid as fixed income shows early signs of selective stabilization following weeks of structural breakdown. One session does not make a trend but worth monitoring for follow-through
Downside:
(XLV) -1% Healthcare absorbing a meaningful single-session distribution event as institutional capital continues rotating from defensives into energy and growth. The same healthcare-to-energy rotation that has defined September is accelerating into October
(XLI) -0.9% Industrials fading alongside healthcare as cyclical defensives face institutional exits. The two most classically defensive domestic sectors both in the red on the same session energy makes an All-Time High tells you the rotation is deliberate
(HYG) -0.30% High-yield credit continuing its quiet breakdown. Credit stress persisting beneath the surface of a market making All-Time Highs in select names is the macro risk signal that deserves ongoing attention
Fresh All-Time Highs:
XLE Energy sector printing yet another All-Time High. This is now multiple consecutive weeks of XLE at or near historic levels. The Physical Over Digital Alpha energy thesis is not a trade, it is a structural regime
MAGS Magnificent Seven extending its All-Time High run alongside energy. Growth and energy making history simultaneously on the same tape confirms the bull market is not narrowing into one theme
VOL SURFACE WATCH (SPY) — October 16 expiration (3 DTE)
Metric Reading
IV ATM 12.2%
Historic Volatility 9.7%
IV Rank 13.2%
IV vs HV IV above HV; options pricing more than realized vol
$785 Call Wall 63k OI; enormous ceiling
$780 Call Wall 27k OI; secondary resistance
$772 Put Wall 46k OI; massive gravitational support
$770 Put Wall 24k OI; secondary support
The $785 call wall at 63k OI is the most important number on the tape with 3 DTE. SPY ~$777 is sitting $8 below that wall with only three days to October expiration. The gamma structure is tightening rapidly; that $785 wall is a ceiling of extraordinary gravitational force into Friday. A break above it would trigger a significant gamma squeeze accelerating price toward $790+. A failure to break through means price pins below $785 into expiration as market makers hedge their exposure.
The $772 put wall at 46k OI is your structural floor; that level has significant gamma support from both sides. SPY is currently trading in the zone between a massive put wall support and a massive call wall resistance with 3 DTE. This is a pinning environment. The most likely outcome into Friday expiration is a range-bound tape between $772 and $785 unless a significant catalyst breaks the structure.
With IV Rank at 13.2% and IV at 12.2% against HV of 9.7%, the options market is pricing more uncertainty than the market has recently realized heading into expiration.
5-DAY LEADERBOARD
Top 3 Gainers (Rolling 5 Days):
XLE +5% New All-Time High Energy delivering its strongest sustained five-day performance in weeks as the Physical Over Digital Alpha real asset thesis continues to compound. XLE at an All-Time High with +5% five-day and XOP surging +2% today confirms the energy complex is in institutional accumulation mode across the full upstream and downstream value chain
UNG +4% Natural gas maintaining its recovery momentum for the second consecutive week. Seasonal demand, supply disruption from Hurricane Isaias, and the broader energy bid are all contributing to UNG’s sustained five-day strength
(XLP) +3% Consumer staples delivering a notable five-day return alongside energy. The combination of energy and consumer staples leading the five-day leaderboard signals institutional capital is positioning defensively within an otherwise bullish market; quality and yield alongside real assets
Top 3 Losers (Rolling 5 Days):
EWY -11% South Korea absorbing a sharp five-day decline. The Bolsonaro election results that drove Brazil’s extraordinary surge last week are creating a relative value divergence within EM; resource-rich exporters winning, tech-heavy Asian manufacturers losing. EWY’s -11% five-day loss following last week’s -7.7% means the pullback is deepening, not stabilizing. The July correction did not fully recover; this one demands respect
URA -11% Uranium giving back its entire September recovery in two weeks. The clean energy infrastructure narrative faces cost of capital headwinds from elevated yields and dollar strength that are proving more powerful than the AI power demand tailwind in the near term
SOXX -9% Semiconductors in a significant five-day breakdown as MU -5% today leads the semi complex lower. The AI hardware thesis that drove triple-digit 52-week returns is facing its most serious near-term momentum challenge of the year. SOXX -9% five-day alongside EWY -11% confirms that the Asian technology and semiconductor complex is under coordinated institutional pressure
Top 3 Market Observations (Past 5 Days):
SHORT EWY South Korea’s -11% five-day loss deepening from last week’s -8% confirms the near-term momentum is decisively lower. Unlike the May correction which fully recovered, this breakdown has different characteristics
SHORT URA Uranium’s -11% five-day collapse with no floor confirmed; the cost of capital headwind is overwhelming the AI power demand narrative in the near term
SHORT SOXX Semiconductors’ -9% five-day decline led by MU weakness confirms the AI hardware complex is in meaningful near-term distribution
THE ENERGY REGIME: XLE ALL-TIME HIGH AGAIN
XLE printing another All-Time High demands a direct statement: this is now a sustained structural regime, not a series of individual data points.
Energy has delivered All-Time Highs across multiple consecutive weeks. XOP surging +2% today alongside XLE’s historic print confirms the bid is broad across upstream exploration and production, not concentrated in one sector expression. UNG +4% five-day adds the natural gas dimension. USO’s triple-digit 52-week return is the full-year confirmation.
The macro drivers remain intact and reinforcing: geopolitical risk premium from Houthi escalation and Saudi coalition response, weather-driven supply disruptions from Hurricane Isaias in the Gulf of Mexico, and the structural Physical Over Digital Alpha thesis that real assets outperform digital growth in an elevated rate environment.
XLE at an All-Time High while TLT is near All-Time Lows is the single most important cross-asset relationship of 2026. Energy wins when fixed income loses. That relationship has held consistently across the full year.
THE SEMICONDUCTOR QUESTION
SOXX -9% five-day and MU -5% today raises an important question: is the AI hardware thesis breaking down or digesting?
The honest answer is that it is digesting within an intact 52-week structural trend. SOXX +93% on the 52-week horizon means the current -9% five-day pullback is a 10% mean reversion within a structural bull trend, not a breakdown. MU crossing back above $1,000 three weeks ago and now pulling back to the $930s is normal price action after a historic run.
STRATEGIC OUTLOOK
October’s second week includes XLE and MAGS at All-Time Highs, healthcare and industrials under distribution, semiconductors in a meaningful five-day pullback, and SPY pinned between massive put and call walls with 3 DTE to October expiration.
The systematic read: energy and growth are the confirmed trends. Defensives and Asian tech are the near-term distribution targets. The pinning dynamic between $772 and $785 means this week’s expiration resolves quietly unless a catalyst breaks the structure.
Next week brings a fresh November expiration and a clean tape reset. Watch whether energy’s All-Time High momentum extends, whether semiconductors find support at prior breakout levels, and whether the $772-$785 range expands or contracts as October expiration clears.
Stay long confirmed energy and growth trends. Respect the semiconductor digestion. Watch the $785 gamma ceiling.
TOP 3 CHARTS (1-Year, Barchart RSI 14)
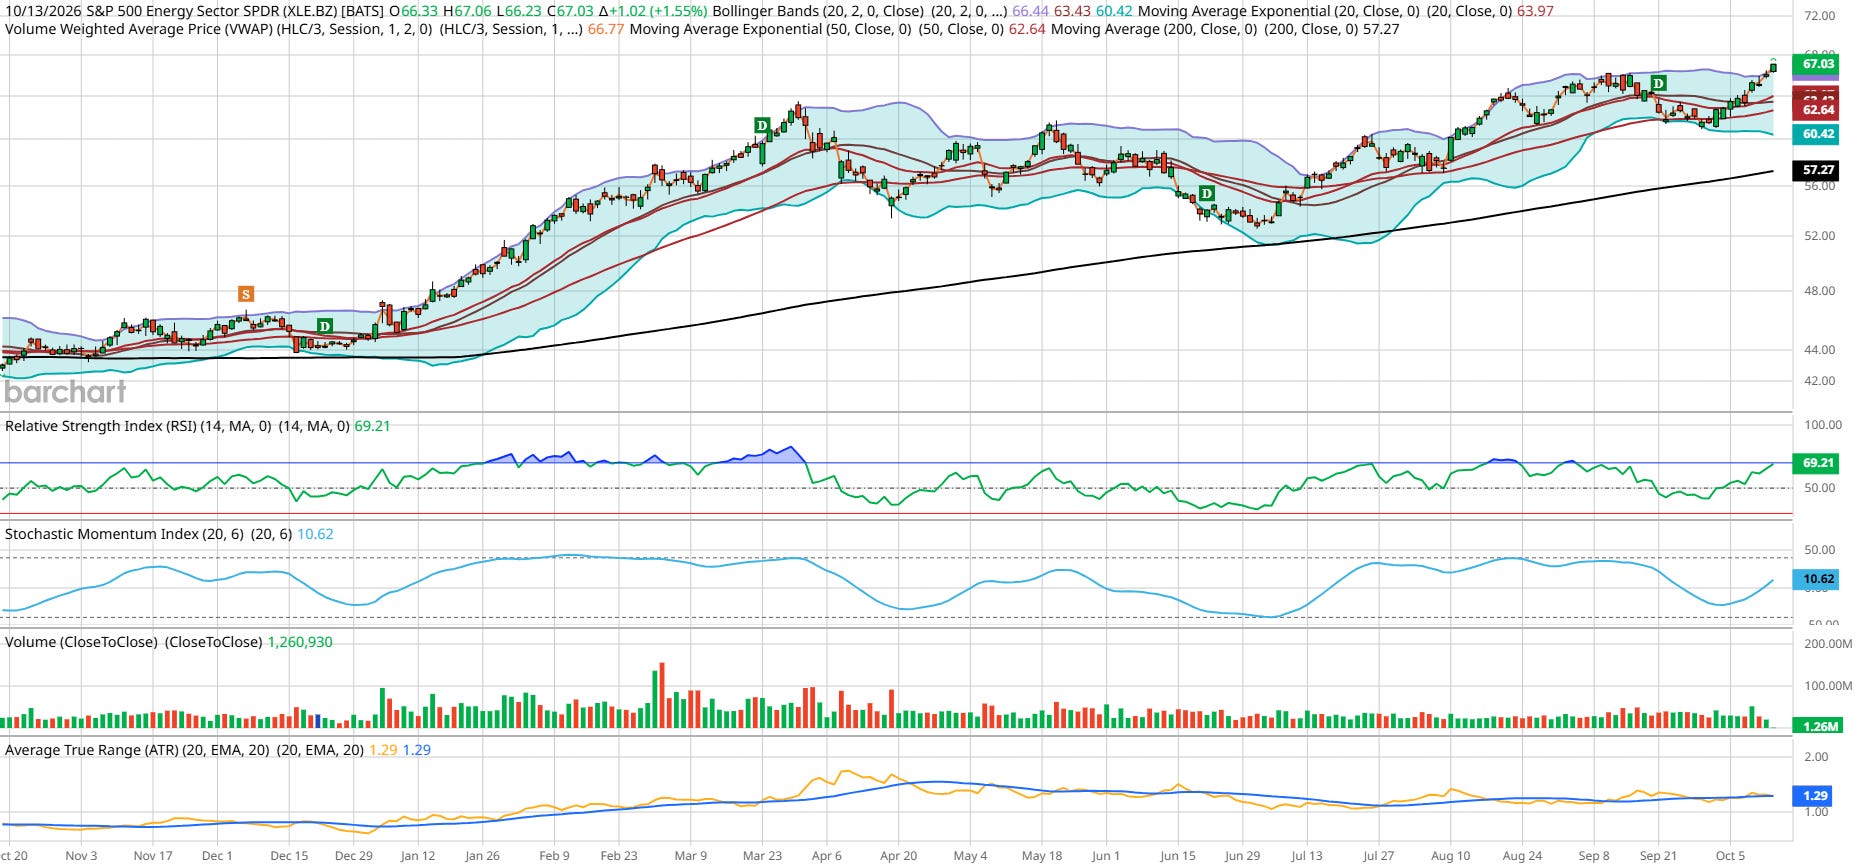
XLE Energy sector at another All-Time High. The one-year chart showing the sustained institutional accumulation that has made energy the defining trend of 2026
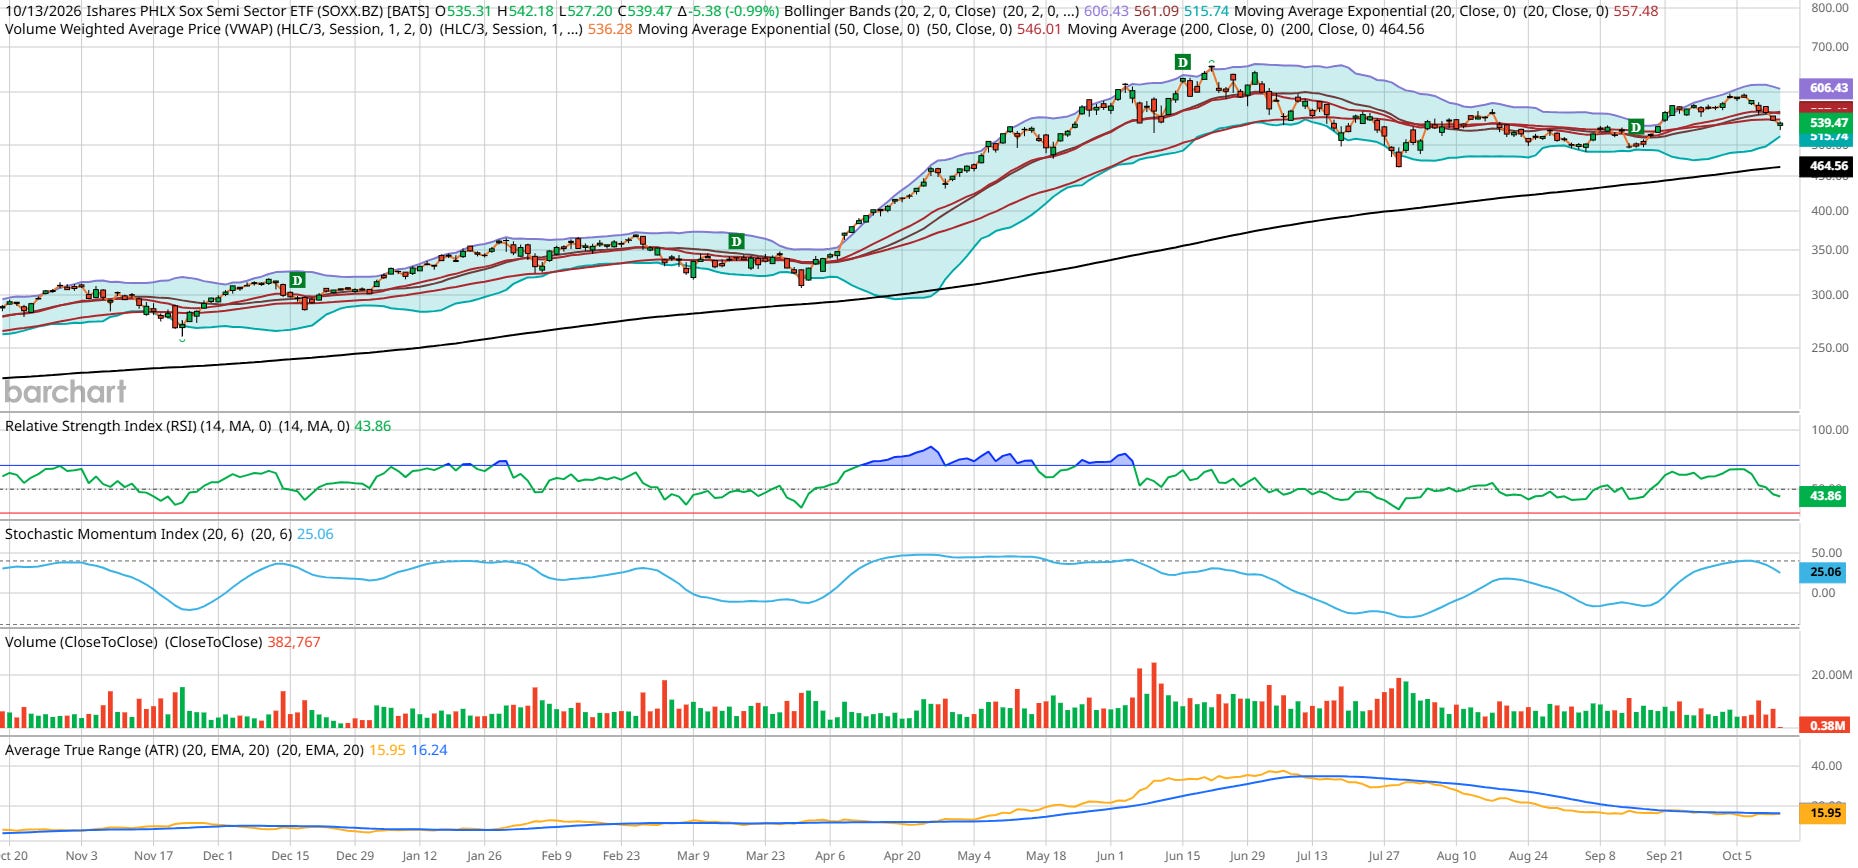
SOXX Semiconductors’ -9% five-day pullback within a strong 52-week uptrend. The digestion versus breakdown question told in one chart
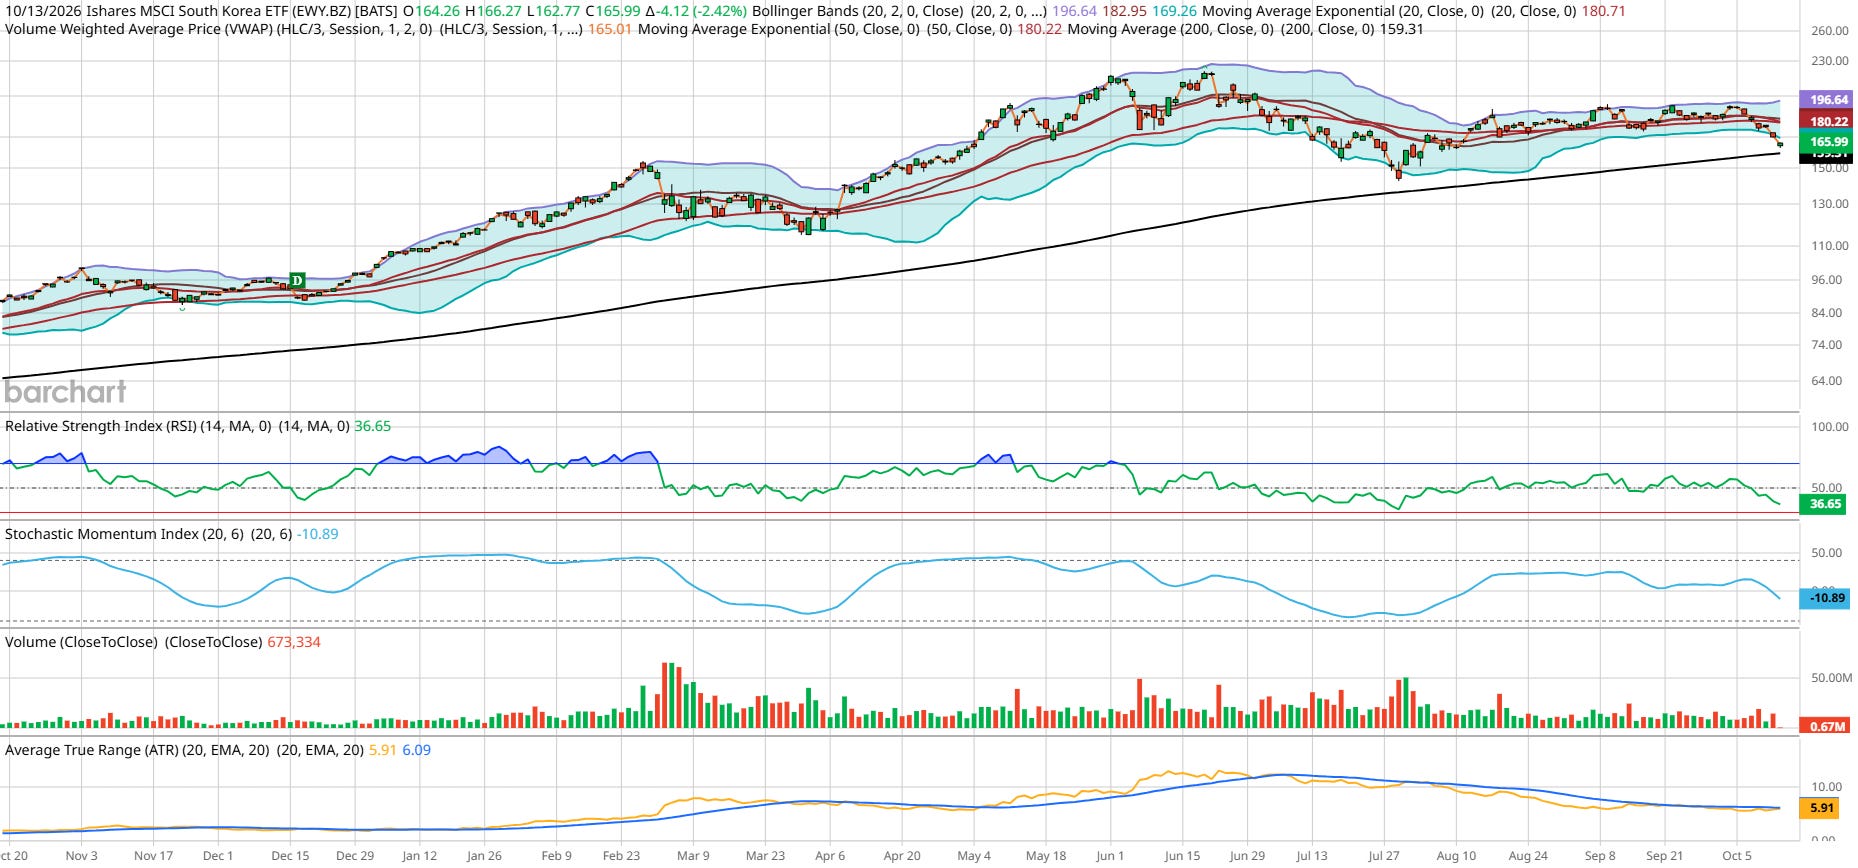
EWY South Korea’s -11% five-day loss deepening from last week’s -8%.
Physical Over Digital Alpha publishes Tuesday and Thursday. Institutional ETF and market strategy for practitioners who trade what they write. Now a Featured Author at Barchart.com.
Use the same charts behind every Physical Over Digital Alpha breakdown — try Barchart Premier free: barchart.com/get-barchart-premier?fpr=h1fuww
— John Salama, CMT | Proprietary Equity Derivatives Trader, Maverick Trading