


With US CPI out today, Wednesday, October 14, stock markets may be in wait-and-see mode. I think it's a good time to look back at the S&P 500, because the wave structure has been playing out nicely, and to share what I'm watching from here.
During the recent setback, I identified a completed correction at 7,513, and that call played out well. The index turned back up from that area, followed by a very nice break higher, just as the wave count suggested.
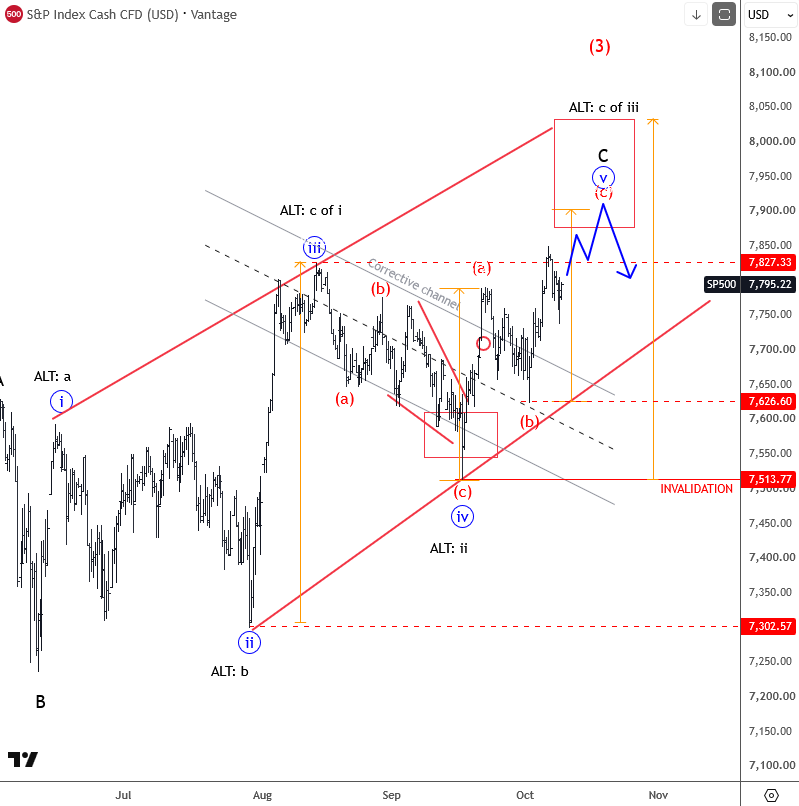
For me, this is the beauty of Elliott Wave. It doesn't only tell you where a move may go, it also helps you recognize when a correction is likely over, so you can switch your view at the right time.
Now the S&P 500 has been trading at new all-time highs, and I see this break higher as wave five. Wave fives can be strong, but they're also the final leg of a bigger move, so I like to stay positive while also being careful. On the bigger picture, I see the S&P 500 unfolding an extended bullish impulse within wave III, which can come to an end sometime in 2026.
In my view, this wave five can extend toward 7,900, maybe even the 8,000 area, which could be a major resistance zone for the index.
If you'd like to follow these wave counts with me day by day, new members can get the first month of full WaveTraders access for just €20 – take a look here.
But here's the important part, and I want to be very clear about it: a strong reversal and a break below 7,630, together with a break through the lower trend line of the pattern, would be very bearish. As long as that doesn't happen, I'll treat dips as part of the wave five rally. If it does, I would start to think that the top may already be in and that a deeper decline could be underway.
Levels to watch:
- Upside zone: 7,900, maybe 8,000 (major resistance)
- Key support: 7,630 – a strong reversal below it, together with a break of the lower trend line, would be very bearish
- Prior correction low: 7,513
CPI could easily shake things up today, so I'd focus on the levels rather than the headlines.
I also talked about the S&P 500 in Monday's Elliott Wave Live webinar, from minute 19:16 onward, so if you'd like to hear my view in more detail, the recording is below.
Grega