


Why Dave Stock Is Back in Focus
Fresh analyst reiterations and Dave (DAVE)’s latest quarterly figures, including reported revenue of US$170.79 million and net profit of US$6.69 million, have pushed the stock back onto investors’ screens.
For context, Dave’s share price has climbed 65.33% year to date and the 1 year total shareholder return sits at 67.80%, even though the 90 day share price return is down 17.19%. This suggests that longer term momentum remains intact despite a recent cooldown.
Scan beyond Dave to see how other potential breakout candidates stack up in our curated list of 20 high quality undiscovered gems.
Dave now trades below the most followed fair value estimate, while analyst targets sit higher and the stock has already run hard this year. Where does a reasonable fair value range actually land within that spread?
Most Popular Narrative: 18% Undervalued
On the narrative view, Dave’s fair value of $444.21 sits above the latest close at $362.87. This puts the current debate squarely on whether its AI driven credit engine and funding structure can sustain that gap.
Ongoing advances in CashAI, with v5.5 associated with record-low loss metrics and v6 built on more than 700 features and already supporting higher credit limits at similar loss ranges, point to a scalable credit engine that can support higher ExtraCash originations and gross profit while helping protect net margins.
See why 44 investors see Dave as 18% undervalued.
Result: Fair Value of $444.21 (UNDERVALUED)
Still, two pressure points could flip the Dave story fast: the unresolved DOJ matter and any stumble in CashAI or off balance sheet funding performance.
Find out about the key risks to this Dave narrative.
Another View: What Dave’s P/E Is Telling You
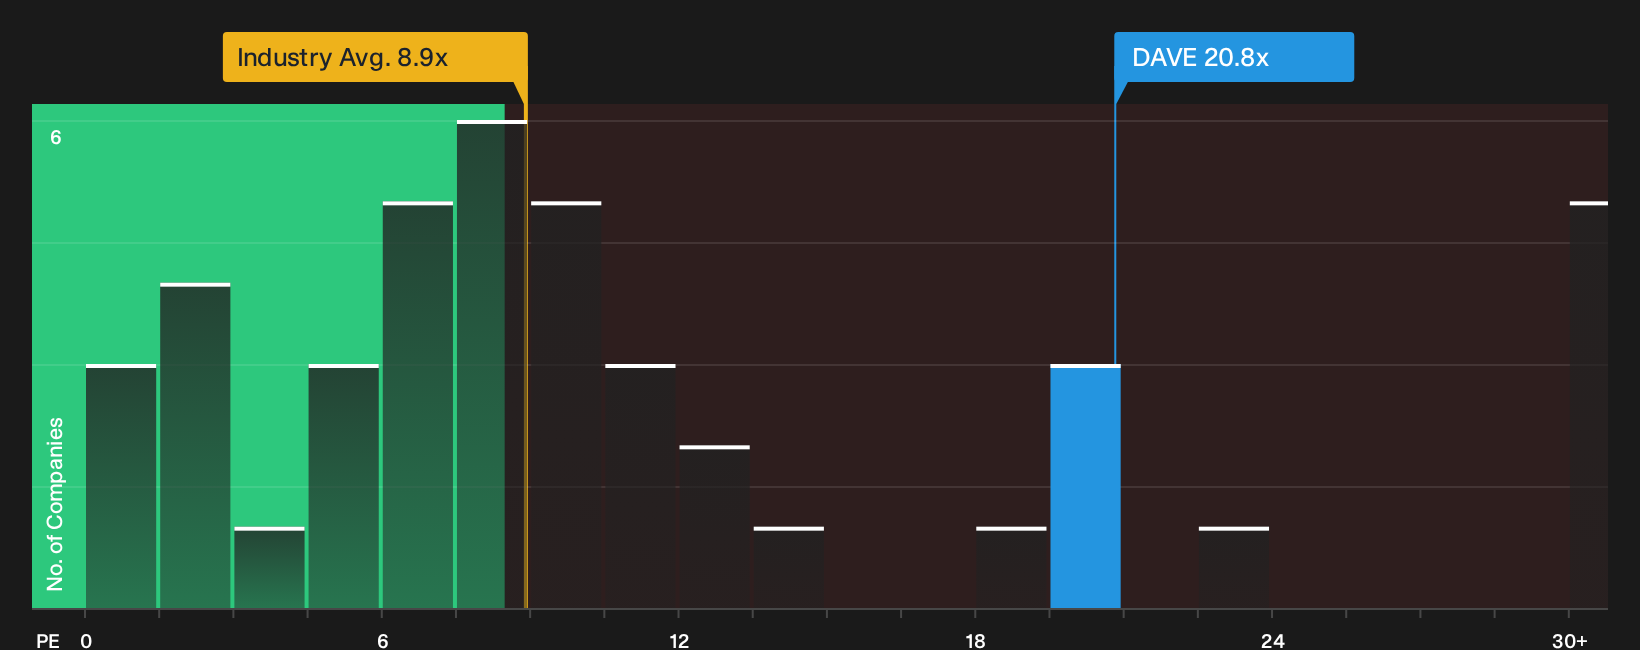
The fair value narrative paints Dave as 18% undervalued, yet the market’s own multiple tells a different story. At a P/E of 20.8x versus a peer average of 11.1x and a fair ratio of 19.8x, investors are paying a clear premium. Is that extra valuation cushion really justified by future execution?
See what the numbers say about this price — find out in our valuation breakdown.
Next Steps
Mixed signals around Dave, including both flagged issues and bright spots, make this a moment to move quickly and pressure test the thesis yourself. Start by weighing the 3 key rewards and 1 important warning sign.
Looking For More Ideas Beyond Dave?
If Dave has you thinking differently about what belongs in your portfolio, do not stop at a single ticker when a wider menu of opportunities is right there.
- Target resilient balance sheets and cleaner fundamentals by scanning the list of solid balance sheet and fundamentals (25 results) to spot businesses that may better handle shocks.
- Hunt for mispriced quality by using the 32 high quality undervalued stocks and see which stocks the data suggests may offer more for every dollar you commit.
- Strengthen your income stream by reviewing the 8 dividend fortresses so you are not leaving potential yield ideas on the table.
This article by Simply Wall St is general in nature. We provide commentary based on historical data and analyst forecasts only using an unbiased methodology and our articles are not intended to be financial advice. It does not constitute a recommendation to buy or sell any stock, and does not take account of your objectives, or your financial situation. We aim to bring you long-term focused analysis driven by fundamental data. Note that our analysis may not factor in the latest price-sensitive company announcements or qualitative material. Simply Wall St has no position in any stocks mentioned.
Have feedback on this article? Concerned about the content? Get in touch with us directly. Alternatively, email editorial-team@simplywallst.com