


Pan Pacific International Holdings (TSE:7532) just posted its September 2026 sales update, reporting domestic comparable store sales at 103.1% year over year. This caught investor attention after the stock climbed 4% against a weaker Nikkei 225.
That 4% one day share price gain sits against a tougher recent run, with the 30 day share price return down 2.86% and the 90 day move down 17.85%. The 3 year total shareholder return of 23.55% and 5 year total shareholder return of 44.92% point to a longer record that investors will weigh against the latest sales and funding updates.
Scan how Pan Pacific International Holdings compares with other retailers reacting to sales momentum by reviewing the hand picked 74 high quality undiscovered gems.Pan Pacific International Holdings trades at a sizeable discount to analyst targets, yet the share price has been weak for months. Is the market rightly cautious, or is it overlooking what recent sales and funding moves imply for value?
Price-to-Earnings of 19.2x: Is it justified for Pan Pacific International Holdings?
On a simple earnings yardstick, Pan Pacific International Holdings trades on a P/E of 19.2x, which places the ¥705.3 share price between peer-level value support and a richer sector comparison.
The P/E ratio tells you how much you are paying for each unit of earnings. For a retailer like Pan Pacific International Holdings, it captures what the market is willing to pay for current profitability and the earnings growth profile that analysts expect to see carried forward.
Against a peer group average of 23.4x, the 19.2x multiple looks restrained and signals that the market is not assigning a premium multiple to Pan Pacific International Holdings despite its record of high quality earnings and consistent profit growth over the past five years. Compared to the wider JP Multiline Retail industry, where the average stands at 15x, the stock trades at a clear premium, which suggests investors are willing to pay more than the typical multiline retailer multiple. The fair P/E ratio estimate of 20x sits slightly above the current level, which is a point the market could move towards if sentiment or results support a higher earnings valuation.
Explore the SWS fair ratio for Pan Pacific International Holdings.
Result: Price-to-Earnings of 19.2x (ABOUT RIGHT)
Still, the weak 1 year share price return and the sharp 90 day pullback suggest sentiment could stay fragile if sales momentum or net income growth fade.
Find out about the key risks to this Pan Pacific International Holdings narrative.
Another View on Pan Pacific International Holdings: Cash Flows Paint a Tougher Picture
The earnings multiple paints Pan Pacific International Holdings as roughly fairly priced, yet the SWS DCF model points in a different direction. At ¥705.3, the share price sits above an estimated future cash flow value of ¥530.18, which implies the stock screens as overvalued on this cash based yardstick. That gap raises a simple question for investors: Which signal deserves more weight, today’s profits or the cash flows analysts expect the business to generate over time?
Look into how the SWS DCF model arrives at its fair value.
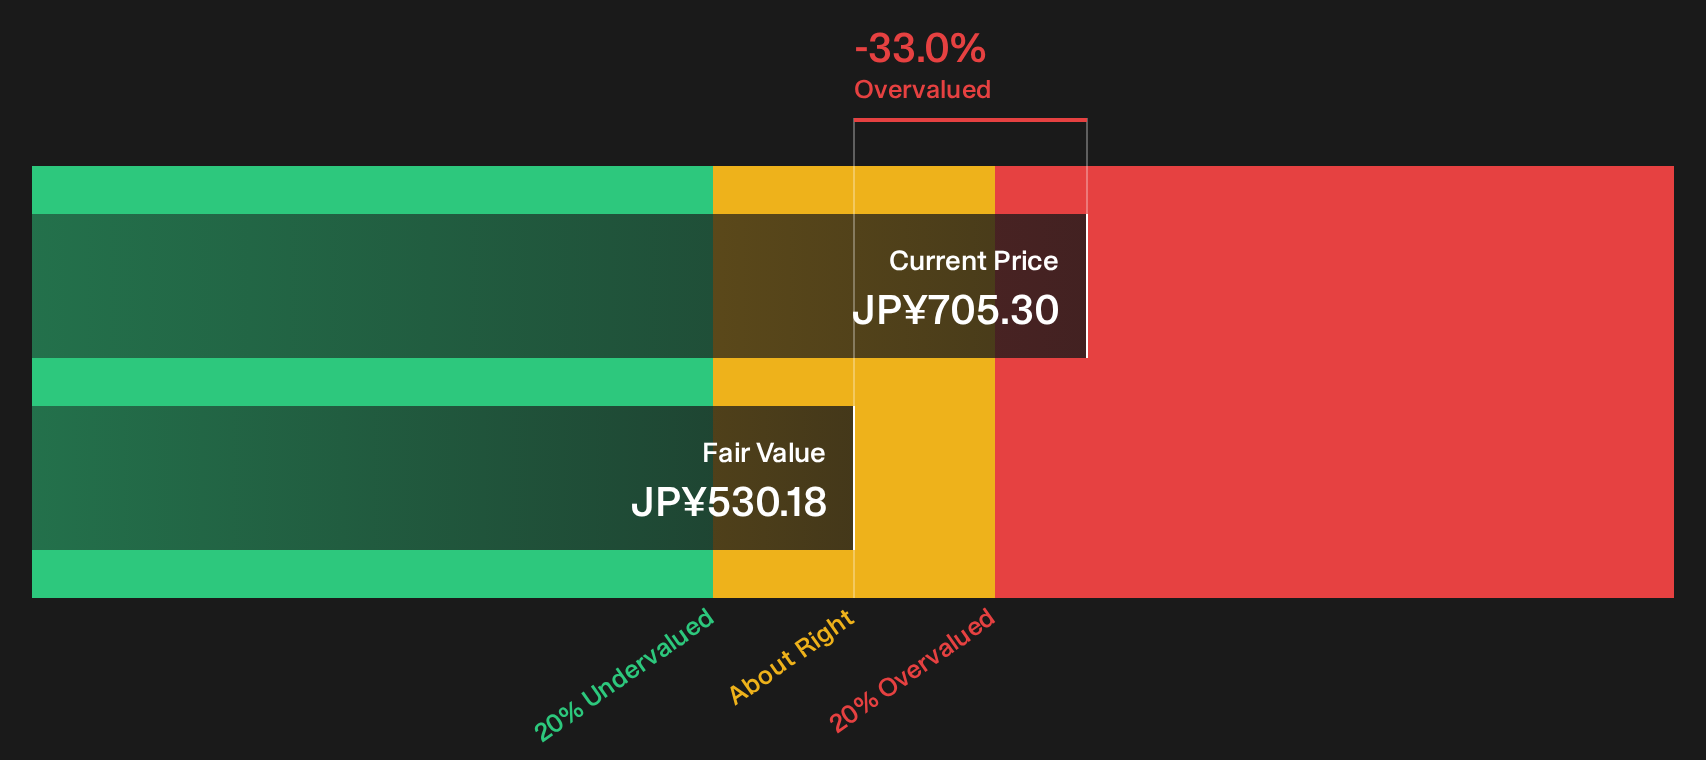
Simply Wall St performs a discounted cash flow (DCF) on every stock in the world every day (check out Pan Pacific International Holdings for example). We show the entire calculation in full. You can track the result in your watchlist or portfolio and be alerted when this changes, or use our stock screener to discover 13 high quality undervalued stocks. If you save a screener we even alert you when new companies match - so you never miss a potential opportunity.
Next Steps
Sentiment in this piece may feel mixed, so treat it as a prompt to check the data yourself and then decide how Pan Pacific International Holdings fits your plan. To balance the concerns, look at the 3 key rewards
Looking for more investment ideas beyond Pan Pacific International Holdings?
If Pan Pacific International Holdings is only one piece of your watchlist, it makes sense to scan wider so you are not missing stronger setups or cleaner balance sheets elsewhere.
- Target resilient compounding potential by reviewing 13 high quality undervalued stocks that pair solid fundamentals with prices that sit below many investors' radars.
- Protect your downside first and let upside take care of itself by focusing on 24 resilient stocks with low risk scores designed to keep volatility in check.
- Strengthen the quality of your watchlist by filtering for a list of solid balance sheet and fundamentals (21 results) that can better handle funding pressure or earnings surprises.
This article by Simply Wall St is general in nature. We provide commentary based on historical data and analyst forecasts only using an unbiased methodology and our articles are not intended to be financial advice. It does not constitute a recommendation to buy or sell any stock, and does not take account of your objectives, or your financial situation. We aim to bring you long-term focused analysis driven by fundamental data. Note that our analysis may not factor in the latest price-sensitive company announcements or qualitative material. Simply Wall St has no position in any stocks mentioned.
Have feedback on this article? Concerned about the content? Get in touch with us directly. Alternatively, email editorial-team@simplywallst.com